Korean Traditional Table Template – Financial Planning and Investment Returns
RJ0600006_13
- Last Update 06/22/2025
- File Size 2.2MB
- # of Slides 2
- File Format PPTX
- Slide Ratio 16:9
- Color
Keywords
- #Content-Based Slides
- #Design-Based Slides
- #Financial Plans and Performance
- #Diagram
- #Projected Return on Investment (ROI)
- #Balance Sheet
- #Table
- #Standard Table
- #16:9
- #table PowerPoint slide
- #financial comparison template
- #data organization slide
- #3-column table design
- #investment returns chart
- #financial planning presentation
About the Product
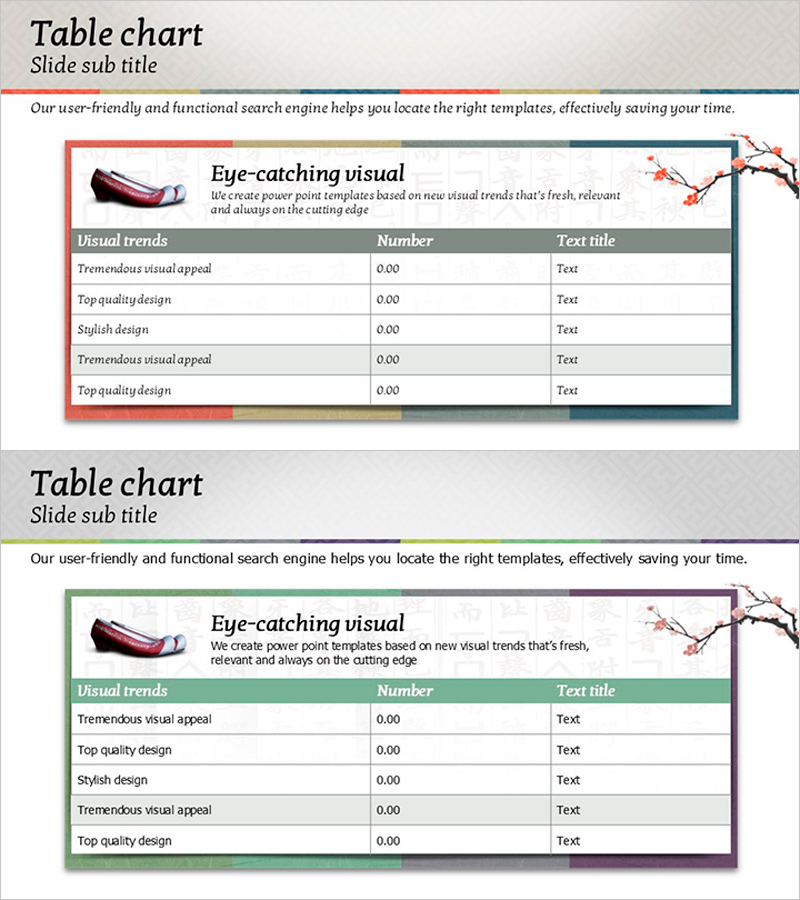
A 3-column, 5-row table PowerPoint slide designed to present financial planning and investment return data with clarity. Features a gradient border in red, gold, gray, and blue tones, with a gray header row that emphasizes data hierarchy. The left side includes an icon area and the right side displays an illustration, providing visual context for your financial narrative. Each row accommodates item names, numerical values, and descriptions, making it suitable for financial metrics, investment options, and performance comparisons. The 2-slide set offers color variations (red accent and green accent) to match different presentation scenarios.
Usage Points
-
Main Usage
Organize and compare quantitative data such as financial metrics, investment options, and performance results in a structured row-column format. Present decision-making evidence clearly by arranging item names, numerical values, and descriptions in each row.
-
How to Use
Enter category names (Visual trends, Number, Text title, etc.) in the header row. Fill each data row with items, values, and descriptions. Replace the left icon area with relevant images and customize the right illustration to match your presentation topic and reinforce context.
-
Recommended For
Presentations to CFOs, finance professionals, and investors. Ideal for business plans, investment pitch decks, financial reports, quarterly and annual performance reviews, and investment option evaluation materials.
-
Slide Structure
3-column (Visual trends, Number, Text title) × 5-row data table layout. Header row features gray background for emphasis, while data rows have white backgrounds. Left side includes icon area, right side displays illustration area, with title and descriptive text sections at the top.
Related Products
-

Simple Circle Presentation Template Doughnut Chart – Visualizing Financial Performance
#Financial Plans and Performance #Diagram #Graph
-

Trend Color Wide Template Map&Table – The Essence of Marketing Strategy Visualization
#Marketing Plan and Strategy #Financial Plans and Performance #Diagram
-

Paint Splash Doughnut Chart – Sensuous Visuals
#Business Introduction #Financial Plans and Performance #Diagram
-

Yellow Brown Table Chart – Visualizing Financial Plans and Performance
#Financial Plans and Performance #Diagram #Balance Sheet
