Summer Vacation Template Table – Visualizing Financial Performance
RJ0500046_12
- Last Update 06/19/2025
- File Size 0.3MB
- # of Slides 2
- File Format PPTX
- Slide Ratio 16:9
- Color
Keywords
- #Content-Based Slides
- #Design-Based Slides
- #Financial Plans and Performance
- #Diagram
- #Projected Return on Investment (ROI)
- #Sales and Revenue
- #Table
- #Standard Table
- #16:9
- #table chart PowerPoint
- #comparison table slide
- #data table template
- #financial performance table
- #dual-column table design
- #business metrics PowerPoint slide
About the Product
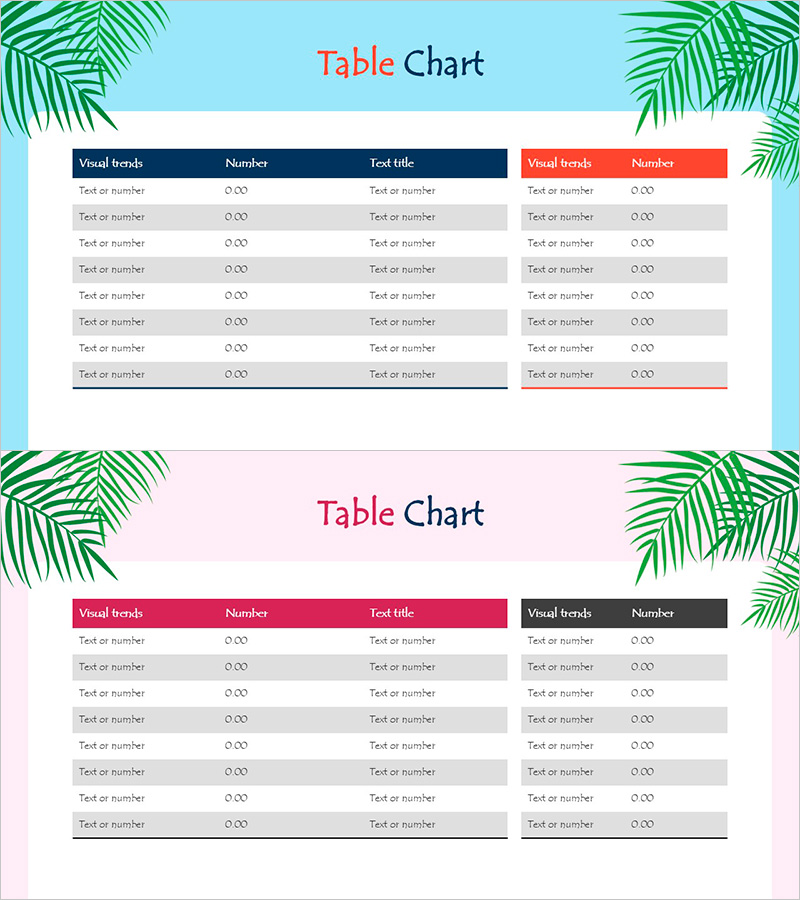
A professional table chart PowerPoint slide designed to present financial performance and business metrics with clarity. The layout features a dual-column design with dark blue header on the left and red header on the right, enabling side-by-side comparison of quantitative data. Each table contains 3 columns (Visual trends, Number, Text title) and 8 rows for comprehensive data organization. The green palm leaf background adds a fresh aesthetic while maintaining focus on data presentation. Ideal for revenue analysis, ROI reporting, performance metrics, and quarterly business reviews. Delivered in 16:9 widescreen PPTX format with 2 slides.
Usage Points
-
Main Usage
Visualize quantitative business data—revenue, KPIs, performance metrics, and comparative analysis—in a structured table format. The dual-column layout allows direct comparison between departments, time periods, or scenarios, while color-coded headers (blue and red) establish clear information hierarchy.
-
How to Use
Input your actual data into the 'Visual trends,' 'Number,' and 'Text title' cells. Assign primary metrics to the left table (blue header) and comparison metrics to the right table (red header) for maximum clarity. The green palm background can be retained for visual consistency or removed if preferred.
-
Recommended For
Finance teams presenting quarterly or annual performance reports, sales teams analyzing revenue and pipeline data, executives reviewing KPI dashboards, investor presentations on financial status, marketing teams comparing campaign performance metrics. Highly effective for data-driven decision-making meetings and board presentations.
-
Slide Structure
Two identical slides, each containing 2 tables (left with dark blue header, right with red header). Each table features 3 columns (Visual trends, Number, Text title) and 8 rows (1 header row + 7 data rows). Consistent 'Table Chart' title and green palm leaf background unify the design across both slides.
Related Products
-

Toy Image and Table – Emphasizing Financial Planning
#Financial Plans and Performance #Diagram #Projected Return on Investment (ROI)
-

Color-highlighted Bar Graphs and Tables – Optimized for Financial Analysis
#Financial Plans and Performance #Diagram #Graph
-

Financial Planning and Scorecard Blue Orange
#Financial Plans and Performance #Diagram #Projected Return on Investment (ROI)
-

Simple Circle Presentation Template Doughnut Chart – Visualizing Financial Performance
#Financial Plans and Performance #Diagram #Graph
