Market Share Pie Chart Blue Yellow – Stylish Analysis
RJ0600002_5
- Last Update 06/21/2025
- File Size 3.2MB
- # of Slides 2
- File Format PPTX
- Slide Ratio 16:9
- Color
Keywords
About the Product
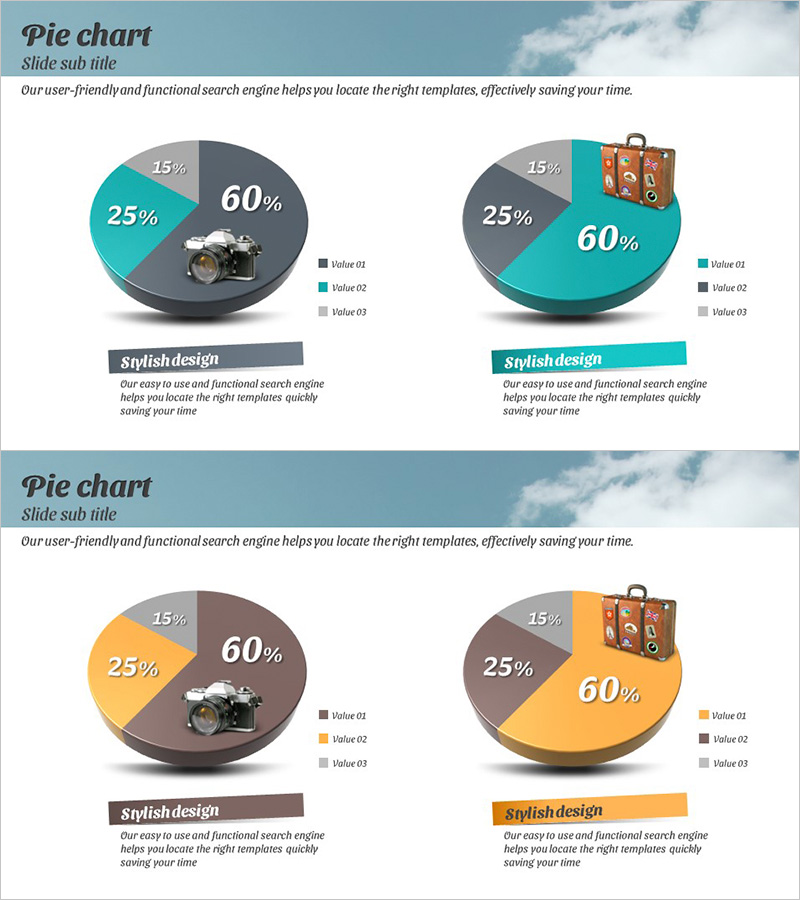
A professional pie chart PowerPoint slide designed to visualize market share, sales distribution, and customer composition across three segments. The design uses contrasting blue and yellow colors to clearly distinguish each section, representing 60%, 25%, and 15% data proportions. The template includes two slide variations: a standard pie chart and an enhanced version with illustrative imagery (camera and suitcase) for added visual context. Formatted in 16:9 widescreen ratio and fully editable PPTX, this slide deck enables quick customization for corporate presentations, investor meetings, and analytical reports.
Usage Points
-
Main Usage
Effectively communicate proportional data such as market share percentages, revenue distribution, customer demographics, and budget allocation. Ideal for executive briefings, investor presentations, quarterly performance reviews, and strategic analysis documents where clear ratio visualization is essential.
-
How to Use
Slide 1 presents the core pie chart with legend and percentage labels. Slide 2 incorporates thematic imagery to enhance visual storytelling. Select the appropriate slide variant for your presentation context, then replace the sample data and labels with your actual figures. All chart elements remain fully editable while maintaining the color scheme.
-
Recommended For
Finance teams, marketing departments, sales executives, and business analysts preparing quarterly reports, investor relations materials, consulting proposals, market analysis presentations, and strategic business reviews. Suitable for any presentation requiring clear visualization of 3-4 component ratios.
-
Slide Structure
Slide 1: Three-segment pie chart with blue (60%), yellow (25%), and gray (15%) sections, accompanied by legend and percentage labels. Slide 2: Identical pie chart enhanced with illustrative elements (camera and travel suitcase imagery) to provide contextual visual reinforcement. All components are independently editable, and chart data updates automatically upon modification.
Related Products
-

Modern Theme Pie Chart – Market Share Analysis
#Product/Service Introduction #Market and Competitor Analysis #Graph
-

Development Status Pie Chart – Visualizing Product Progress
#Product/Service Introduction #Market and Competitor Analysis #Graph
-

Development Status Analysis Circle Graph
#Product/Service Introduction #Market and Competitor Analysis #Graph
-

Market Analysis by Year Pie Chart – Emphasizing Market Share
#Market and Competitor Analysis #Graph #Market Share
