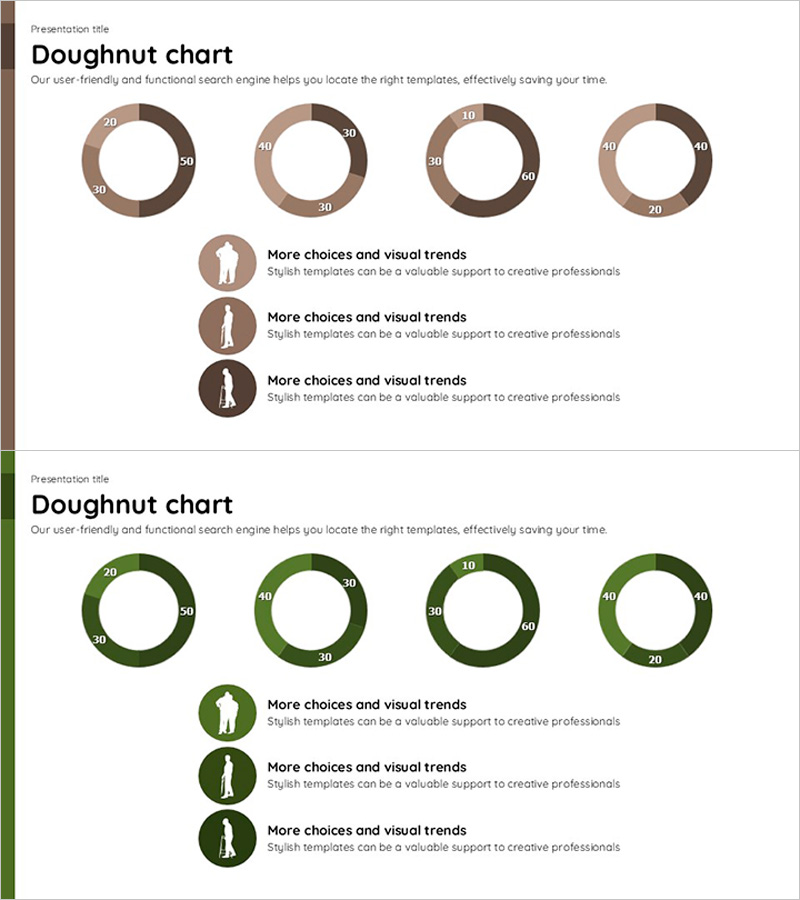
3 Messages About Donut Chart – Utilize Data Visualization Effectively
RJ0600001_23
- Last Update 06/21/2025
- File Size 0.2MB
- # of Slides 2
- File Format PPTX
- Slide Ratio 16:9
- Color
Keywords
About the Product
A 2-slide PowerPoint set featuring doughnut charts for intuitive data ratio visualization. Includes two color versions—brown and green tones—each displaying four distinct doughnut chart designs with clearly labeled numerical values. Perfect for presenting market share, budget allocation, customer segmentation, and composition data in business presentations. The slides combine chart visuals with text boxes and icons, allowing you to add contextual explanations alongside quantitative data. Fully editable and ready to integrate into financial reports, business plans, and strategic presentations.
Usage Points
-
Main Usage
Doughnut charts visually represent the proportion of each component relative to the whole using a circular format. This slide set effectively communicates market share, customer segmentation, budget distribution, and product composition ratios. The hollow center allows you to place key metrics or titles, enhancing information clarity and audience engagement.
-
How to Use
Deploy these slides in market analysis, financial overview, and customer analysis sections of presentations. Use the brown-toned version for corporate reports and financial statements requiring professionalism and credibility. Apply the green-toned version to business plans and marketing proposals emphasizing growth and positive momentum. Replace numerical labels with actual data, add legends, and include supporting text to complete the visualization.
-
Recommended For
Finance professionals, marketing strategists, business executives, business plan developers, market research analysts, and investment pitch presenters. Ideal for anyone needing to communicate quantitative data persuasively to stakeholders and decision-makers.
-
Slide Structure
2-slide format. Slide 1: Brown-toned background with 4 doughnut charts showing varied ratio distributions, plus 3 icon-text boxes for additional context. Slide 2: Green-toned background with identical chart layout and 3 supporting icon-text elements. 16:9 widescreen format, fully editable PPTX.
Related Products
-

Introducing Product Features with Advanced Radar Chart
#Product/Service Introduction #Graph #Features
-

Medicine Bottle Shape Diagram for Market Analysis – Insight Generation
#Market and Competitor Analysis #Diagram #Graph
-

Visualizing South Korea's Market Share – Data-Driven Insights
#Company Introduction #Market and Competitor Analysis #Graph
-

Real Estate Contract Trend Analysis Chart – Visual Data for Business Success
#Business Introduction #Business Strategy #Diagram
