Donut Charts and Analytical Texts – Effective Information Delivery Through Data Visualization
RJ0600001_20
- Last Update 06/21/2025
- File Size 0.1MB
- # of Slides 2
- File Format PPTX
- Slide Ratio 16:9
- Color
Keywords
About the Product
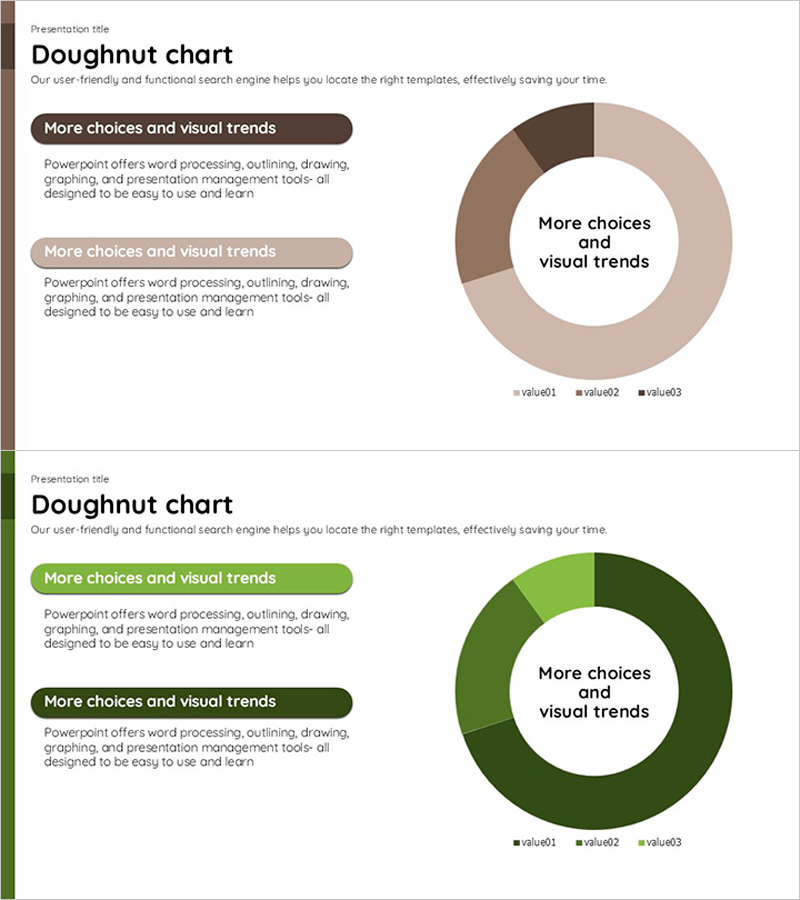
A professional donut chart PowerPoint slide set designed to visualize business data with clarity and impact. This 2-slide template offers two color schemes—brown and green tones—each featuring a 3-segment donut chart for displaying proportional data. The center space accommodates key messaging, while the left text box area provides room for analytical commentary. Ideal for presenting product composition, market share, budget allocation, and organizational breakdowns. The 16:9 widescreen format ensures compatibility with modern presentation environments and displays.
Usage Points
-
Main Usage
Effectively communicate proportional data such as market share, budget distribution, product composition, and organizational structure. The centered donut chart combined with left-aligned text boxes enables simultaneous visual and textual data presentation, enhancing audience comprehension and engagement.
-
How to Use
Input your actual data values into each donut chart segment, customize the center text and left-side analytical descriptions to match your presentation context. Select either the brown or green color scheme based on your corporate branding guidelines and audience preferences.
-
Recommended For
Finance professionals, business analysts, marketing teams, product managers, and executives preparing quarterly reports, investor presentations, strategic reviews, and departmental meetings. Suitable for anyone presenting quantitative data requiring proportional breakdown across multiple categories.
-
Slide Structure
Two-slide set with consistent layout: title area at top, 3-segment donut chart on the right with legend (value01, value02, value03), and dual text boxes on the left (header section with dark background and body text area below). Two distinct color variations—brown and green palettes—provide design flexibility.
Related Products
-

Business Development Progress Graph – A Trendy Business Tool
#Product/Service Introduction #Market and Competitor Analysis #Graph
-

Purple Brown Market Share Analysis – Emphasizing Visual Appeal
#Market and Competitor Analysis #Graph #Other
-

Customer Type Analysis Bar Graph – Data Visualization for Customer Success
#Company Introduction #Market and Competitor Analysis #Customer Success Stories
-

Data Analysis Segmented Bar Graph – Technology Status and Analysis
#Product/Service Introduction #Business Introduction #Graph
