Year Comparison Bar Graph – A Stunning Presentation to Visualize Data
RJ0600001_15
- Last Update 06/21/2025
- File Size 0.1MB
- # of Slides 2
- File Format PPTX
- Slide Ratio 16:9
- Color
Keywords
About the Product
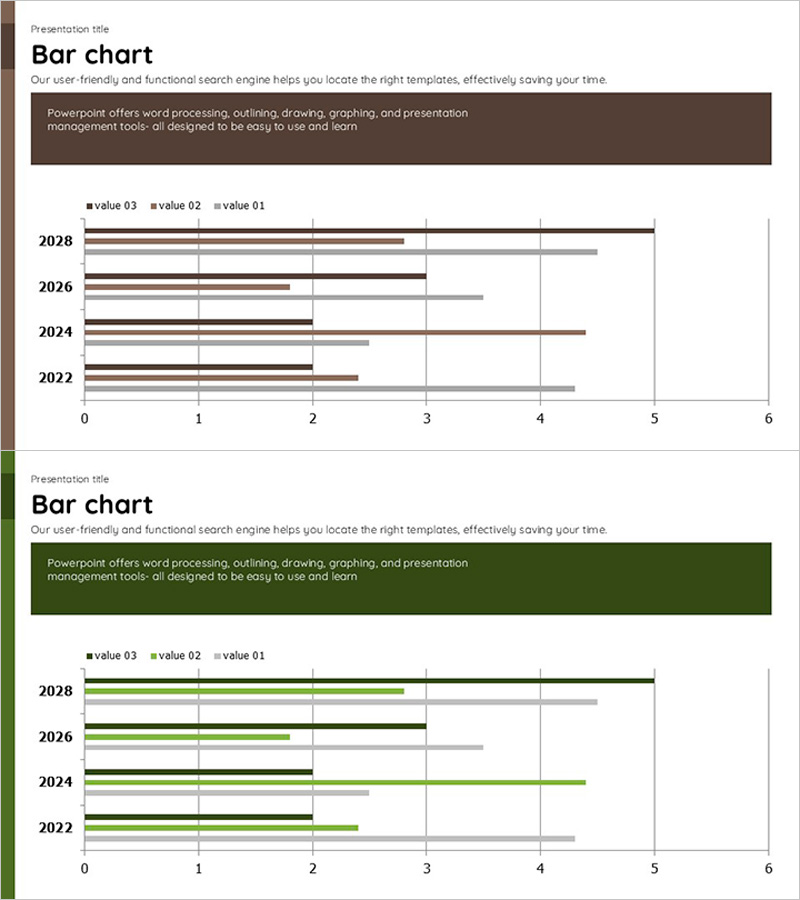
A horizontal bar chart PowerPoint slide comparing data across four years (2022–2028) with three data series. Available in two color themes—brown and green—this slide enables quick visual comparison of year-on-year changes. The scale ranges from 0 to 6, making it suitable for performance metrics, revenue analysis, market share trends, and forecast comparisons across industries. Delivered as a 2-slide deck in 16:9 widescreen format, ready to insert directly into presentations and reports without additional formatting.
Usage Points
-
Main Usage
Designed to compare performance, results, and forecast data across multiple years using three distinct data series. Clearly visualizes numerical changes over time—such as sales revenue, customer count, or market share—making it ideal for executive dashboards and strategic decision-making materials.
-
How to Use
Insert into the performance analysis section of annual reports, use in business plan presentations to show target vs. actual results, or incorporate into investor pitch decks to demonstrate year-on-year growth rates. Simply replace the data values and the bar lengths adjust automatically for rapid report generation.
-
Recommended For
Financial analysts, marketing managers, business planning teams, executives preparing board reports, consulting firms, and academic presenters. Particularly effective for annual trend analysis and comparative performance reviews across departments, regions, or product lines.
-
Slide Structure
Both slides follow an identical layout with four years (2022–2028) on the vertical axis and three data series (value 01, 02, 03) represented as horizontal bars. One slide features a brown color scheme while the other uses green, allowing you to select the theme that best matches your presentation style and document tone.
Related Products
-

Trends in Heavy Equipment Utilization – Market Analysis
#Business Introduction #Market and Competitor Analysis #Graph
-

Formulation Component Analysis of the Drug Slide – Effective Data Visualization
#Product/Service Introduction #Market and Competitor Analysis #Graph
-

Status of Research and Development by Topic – Innovation and Trust
#Product/Service Introduction #Market and Competitor Analysis #Diagram
-

Ship Logistics Equipment Status Analysis – Facility and Market Overview
#Business Introduction #Market and Competitor Analysis #Graph
