Radar Chart for Analysis of Scientific Topic Capabilities – Visualizing Competitiveness
RJ0500048_24
- Last Update 06/20/2025
- File Size 0.7MB
- # of Slides 2
- File Format PPTX
- Slide Ratio 16:9
- Color
Keywords
About the Product
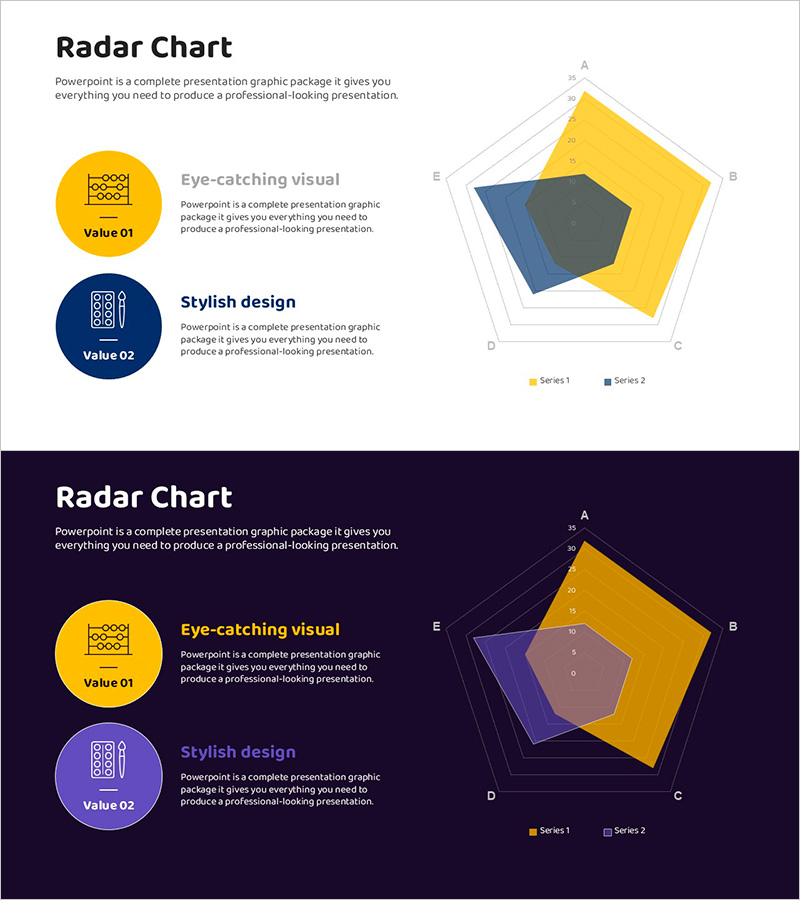
A radial radar chart PowerPoint slide with five axes designed for multi-dimensional data visualization. Features two data series in yellow, gray, and blue color schemes, ideal for competency comparison and competitive analysis. Perfect for scientific topics, capability assessments, and skill evaluations across various fields. The slide includes accompanying text descriptions and icons to enhance presentation credibility. Fully editable PPTX format allows you to customize colors, axis labels, and data values to match your specific analysis needs.
Usage Points
-
Main Usage
Displays multiple competencies, capabilities, or metrics in a radial layout for instant comparative analysis. Ideal for scientific capability evaluation, product competitiveness assessment, organizational capability mapping, individual skill profiling, and multi-dimensional performance benchmarking.
-
How to Use
Insert into the analysis or evaluation section of your presentation, or use as a key metrics page in executive reports. The dual-series design with contrasting colors clearly distinguishes comparison subjects such as competitors, time periods, or target benchmarks.
-
Recommended For
Science and technology presentations, strategic business reports, product competitive analysis, organizational capability assessments, marketing performance reviews, and educational seminars. Recommended for executives, analysts, researchers, and educators requiring data-driven decision visualization.
-
Slide Structure
Two slides featuring a five-axis (A, B, C, D, E) radial radar diagram. First slide displays light background with yellow, gray, and blue data series. Second slide uses dark background with yellow and purple series. Both include left-side icon and text description areas for context and interpretation.
Related Products
-

Competitor Analysis Pentagon Radial Graph – Concept and Strategy
#Market and Competitor Analysis #Graph #Competitor Analysis
-

Goal Setting & Radial Graph – Intuitive Data Visualization
#Business Introduction #Market and Competitor Analysis #Diagram
-

Business Status Analysis Graph & Table – Visualization of Market Analysis
#Market and Competitor Analysis #Diagram #Graph
-

Green Yellow Radial Chart
#Market and Competitor Analysis #Graph #Market Analysis
