Radial Graph for Indoor Lighting Effect Analysis – Modern Approach
RJ0900005_27
- Last Update 08/17/2025
- File Size 1.2MB
- # of Slides 2
- File Format PPTX
- Slide Ratio 16:9
- Color
Keywords
- #Content-Based Slides
- #Design-Based Slides
- #Product/Service Introduction
- #Market and Competitor Analysis
- #Marketing Plan and Strategy
- #Graph
- #Features
- #Market Analysis
- #Other
- #Radar Chart Spider Chart
- #16:9
- #radial chart PowerPoint
- #radial graph slide template
- #5-axis radial diagram
- #data visualization slides
- #how to create radial chart in PowerPoint
About the Product
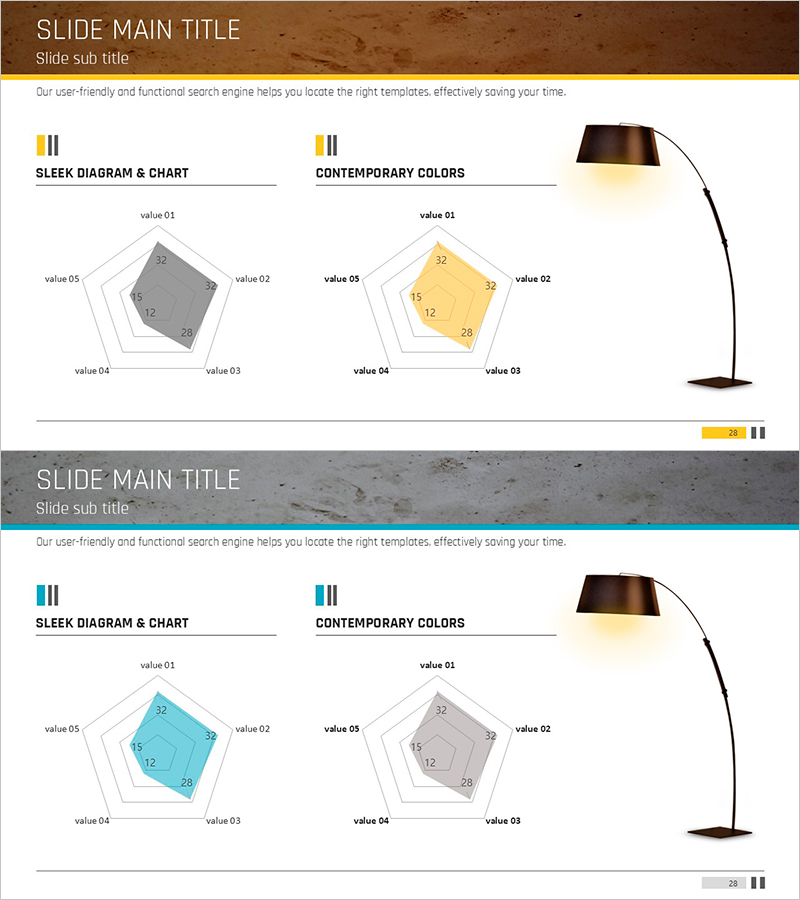
A 5-axis radial chart PowerPoint slide designed for indoor lighting effect analysis and multi-variable data comparison. The radial diagram structure radiates from a central point to five directional axes, enabling intuitive comparison of numerical values across multiple dimensions. Two versions are provided: a gray-tone baseline chart and a yellow-tone emphasis chart, allowing flexible selection based on presentation context. Comprising 2 slides in 16:9 widescreen format, all elements are fully editable for immediate data input. Ideal for market analysis, performance evaluation, capability assessment, and other presentations requiring multi-dimensional data visualization.
Usage Points
-
Main Usage
The radial structure radiating from center to five axes enables simultaneous comparison of multiple data points and reveals overall patterns at a glance. Optimized for expressing multi-dimensional datasets such as lighting effects, performance indicators, and capability assessments with intuitive visual impact.
-
How to Use
Use the gray version for baseline data representation and the yellow version for emphasis and comparative analysis. Replace value 01–05 with your own data, and edit labels and colors as needed before inserting into presentations. Effectively communicates complex data in technical reports, performance analyses, and proposal documents.
-
Recommended For
Data analysts, consultants, marketing professionals, project managers, and researchers presenting performance evaluations, market analyses, capability assessments, and research findings. Suitable for technical documentation, management reports, academic presentations, and consulting proposals requiring clear multi-variable data expression.
-
Slide Structure
2-slide set, each containing one 5-axis radial chart. First slide features gray-tone baseline chart with value 01–05 labels; second slide presents yellow-tone emphasis chart with identical structure. Optimized for 16:9 widescreen format with fully editable shapes, text, and data fields.
Related Products
-

Business Direction Radial Chart – Market and Competitive Analysis
#Product/Service Introduction #Market and Competitor Analysis #Graph
-

Fund Planning Radar Chart – Strategic Visualization
#Product/Service Introduction #Marketing Plan and Strategy #Graph
-

Derived Results by Radar Chart – Market and Competitor Analysis
#Product/Service Introduction #Market and Competitor Analysis #Graph
-

Real Estate Analysis Charts by Consumer Characteristics – Graphs for Market Insights
#Product/Service Introduction #Market and Competitor Analysis #Graph
