Online Shopping Mall System Radial Graph – Dynamic Data Visualization
RJ0400057_20
- Last Update 06/02/2025
- File Size 0.1MB
- # of Slides 2
- File Format PPTX
- Slide Ratio 16:9
- Color
Keywords
- #Content-Based Slides
- #Design-Based Slides
- #Business Introduction
- #Market and Competitor Analysis
- #Graph
- #Technological Status
- #Market Analysis
- #Other
- #Radar Chart Spider Chart
- #16:9
- #radial graph PowerPoint
- #radial diagram slide template
- #7-node data visualization
- #sunburst chart PPT
- #center-point graph design
About the Product
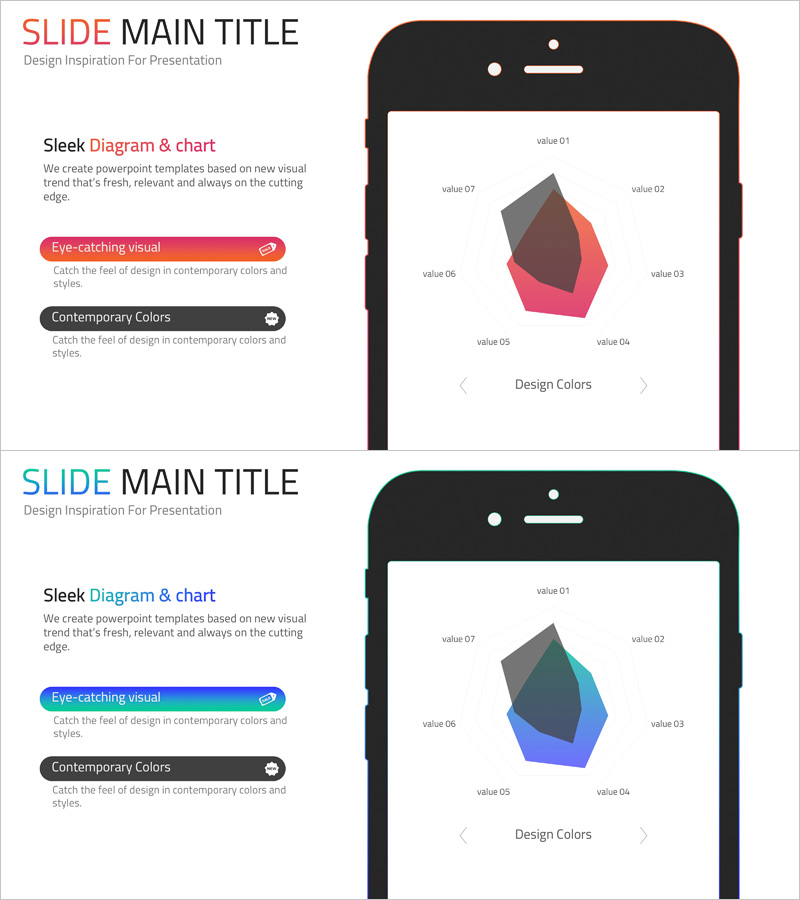
A radial graph PowerPoint slide with seven data nodes radiating from a central point. The design uses pink, gray, and black polygonal shapes to represent data items, with numeric labels (value 01–07) positioned at each node. Ideal for online shopping system analysis, market research, technology landscape, and competitive analysis presentations. The 2-slide set includes color variations in pink and blue tones, optimized for 16:9 widescreen format in PPTX. Perfect for expressing key metrics, relationship diagrams, impact assessments, and distribution patterns in business presentations.
Usage Points
-
Main Usage
Visualizes data structures where multiple items radiate from a central concept. Effective for market analysis (core market with surrounding markets), technology landscape (core technology with related technologies), and competitive analysis (your company with competitor positioning). Emphasizes relationships and distribution patterns.
-
How to Use
Enter your core concept (e.g., company, core technology, primary market) in the center node. Add related items and values to the seven surrounding nodes. Customize node colors, sizes, and labels to match your data. Choose between two color variations (pink or blue tone) based on presentation context. Add or remove nodes as needed.
-
Recommended For
Recommended for marketing strategists, business analysts, consultants, and planners creating market analysis reports, technology landscape presentations, competitive analysis documents, and strategic planning materials. Applicable across industries including e-commerce, IT, manufacturing, and professional services.
-
Slide Structure
One central node with seven data nodes arranged in radial formation. Each node is represented as a polygon shape with value labels (01–07). Two color schemes provided: pink-gray-black tone (slide 1) and blue-gray-black tone (slide 2). Optimized for 16:9 widescreen presentation format.
Related Products
-

Goal Setting & Radial Graph – Intuitive Data Visualization
#Business Introduction #Market and Competitor Analysis #Diagram
-

Ability Analysis Radial Graph – Business Introduction and Market Analysis
#Business Introduction #Market and Competitor Analysis #Graph
-

SNS Business Analysis Circular Graph
#Business Introduction #Market and Competitor Analysis #Graph
-

Technology Status Radial Graph – Modern Design
#Business Introduction #Graph #Technological Status
