Positioning Learning Data – A New Approach to Data Visualization
RJ0500048_12
- Last Update 06/20/2025
- File Size 0.4MB
- # of Slides 2
- File Format PPTX
- Slide Ratio 16:9
- Color
Keywords
About the Product
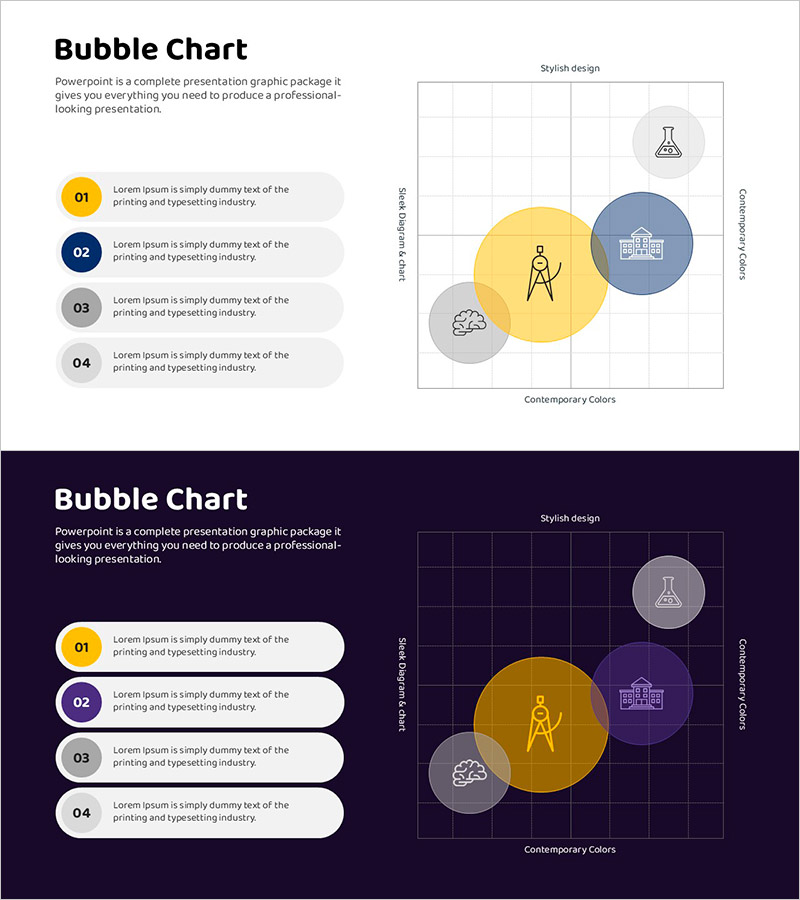
A bubble chart PowerPoint slide that visualizes data relationships using four circular nodes positioned on a two-dimensional coordinate plane. The design features yellow, blue, and gray bubble nodes with embedded icons representing different categories. The left side displays a numbered list (01–04) while the right side shows the bubble chart in symmetrical layout, enhancing information clarity. Two versions are provided: light background and dark background, allowing you to match your presentation environment. Ideal for marketing positioning analysis, market segmentation, learning data classification, and competitive landscape visualization in professional presentations.
Usage Points
-
Main Usage
This bubble chart visualizes the relationship between two variables while representing size data simultaneously. It is commonly used for marketing positioning maps to analyze competitor positions, market segmentation analysis, learning data classification, and customer segment visualization. The size and position of each bubble allow you to grasp multiple data dimensions at a glance.
-
How to Use
Enter item names and descriptions in the left-side numbered list, then reflect corresponding data in the right-side bubble chart nodes. Adjust node sizes according to data values, and customize colors and icons by category. Choose between light or dark background versions to match your presentation tone.
-
Recommended For
Recommended for marketing strategy presentations, market analysis reports, executive summaries, learning data classification explanations, customer segment analysis, competitive positioning analysis, and product portfolio management presentations. Suitable for all business presentations requiring data-driven decision-making visuals.
-
Slide Structure
2-slide set. Slide 1: Light background version (light gray background with black text). Slide 2: Dark background version (dark navy background with white text). Each slide features a 4-item numbered list on the left and a 4-node bubble chart on the right, with node distance and size representing data relationships.
Related Products
-

Positioning Area Graph – Essential Slide for Market Analysis
#Market and Competitor Analysis #Marketing Plan and Strategy #Diagram
-

Analysis of Key Competitor Positioning to Enhance Market Competitiveness
#Market and Competitor Analysis #Marketing Plan and Strategy #Diagram
-

Price Quality Positioning Map – Market and Competitor Analysis
#Market and Competitor Analysis #Marketing Plan and Strategy #Diagram
-

Space Industry Positioning Diagram – Market Analysis and Strategy
#Market and Competitor Analysis #Marketing Plan and Strategy #Diagram
