Market Share Analysis with Donut Chart – Essential for Marketing Goals
RJ0500047_11
- Last Update 06/20/2025
- File Size 0.2MB
- # of Slides 2
- File Format PPTX
- Slide Ratio 16:9
- Color
Keywords
- #Content-Based Slides
- #Design-Based Slides
- #Market and Competitor Analysis
- #Marketing Plan and Strategy
- #Graph
- #Market Share
- #Marketing Objectives
- #Circles
- #Pie Chart
- #16:9
- #pie chart PowerPoint slide
- #pie graph template
- #market share analysis presentation
- #ratio comparison chart
- #data visualization slides
About the Product
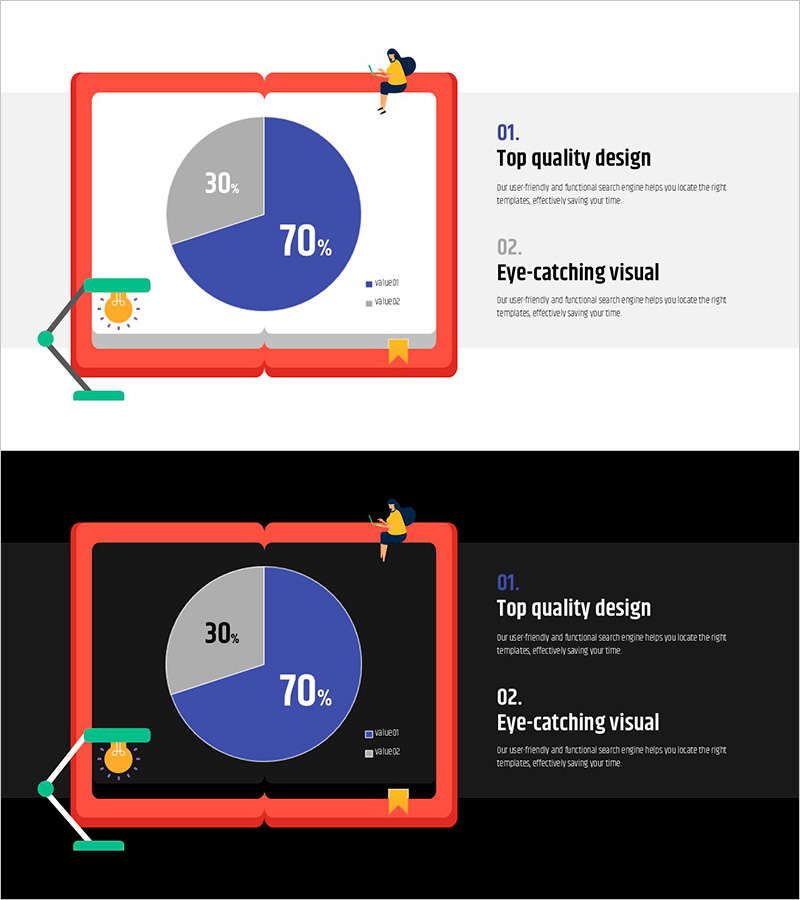
A 2-slide PowerPoint presentation featuring pie chart templates for market share analysis and data visualization. The two-segment pie chart uses navy blue and gray colors to clearly represent proportional relationships and composition analysis. Ideal for marketing presentations, business reports, and strategic analysis meetings. Both light background (white) and dark background (black) versions are included to adapt to different presentation environments. Provided in 16:9 widescreen PPTX format with fully editable text and numerical values for customization.
Usage Points
-
Main Usage
Visualizes proportional data such as market share, sales ratios, and customer composition by segment. Effectively communicates part-to-whole relationships and enables comparative analysis. Suitable for marketing strategy presentations, executive reports, business performance analysis, and data-driven decision-making meetings.
-
How to Use
Replace the 70% and 30% values with your actual data. Edit the legend and labels to clearly identify the categories being analyzed. Customize the title and descriptive text to match your presentation context. Use the light background version for daytime presentations and the dark background version for evening or projection-heavy environments.
-
Recommended For
Marketing managers, executives, business analysts, sales directors, and professionals requiring data-driven reporting. Applicable to quarterly performance reviews, market analysis presentations, customer segmentation studies, product sales reports, and competitive positioning discussions.
-
Slide Structure
Two-slide set with pie charts as the focal point. Each slide features a 2-segment pie chart positioned centrally, with legend and supplementary information on the left side and a text area for key points on the right. One slide with light background and one with dark background for flexible presentation scenarios.
Related Products
-

Pizza Illustration Highlight Pie Chart – Market Share Analysis
#Market and Competitor Analysis #Graph #Market Share
-

Avocado and Strawberry Pie Chart – Market Share Analysis
#Market and Competitor Analysis #Financial Plans and Performance #Graph
-

Target Area Market Share Analysis Graph – Emphasizing Market Competition
#Market and Competitor Analysis #Graph #Other
-

Detailed Analysis Pie Chart – Market Share and Promising Competitors
#Market and Competitor Analysis #Graph #Market Share
