Summer Vacation Template Bent Line Graph
RJ0500046_22
- Last Update 06/20/2025
- File Size 0.3MB
- # of Slides 2
- File Format PPTX
- Slide Ratio 16:9
- Color
Keywords
About the Product
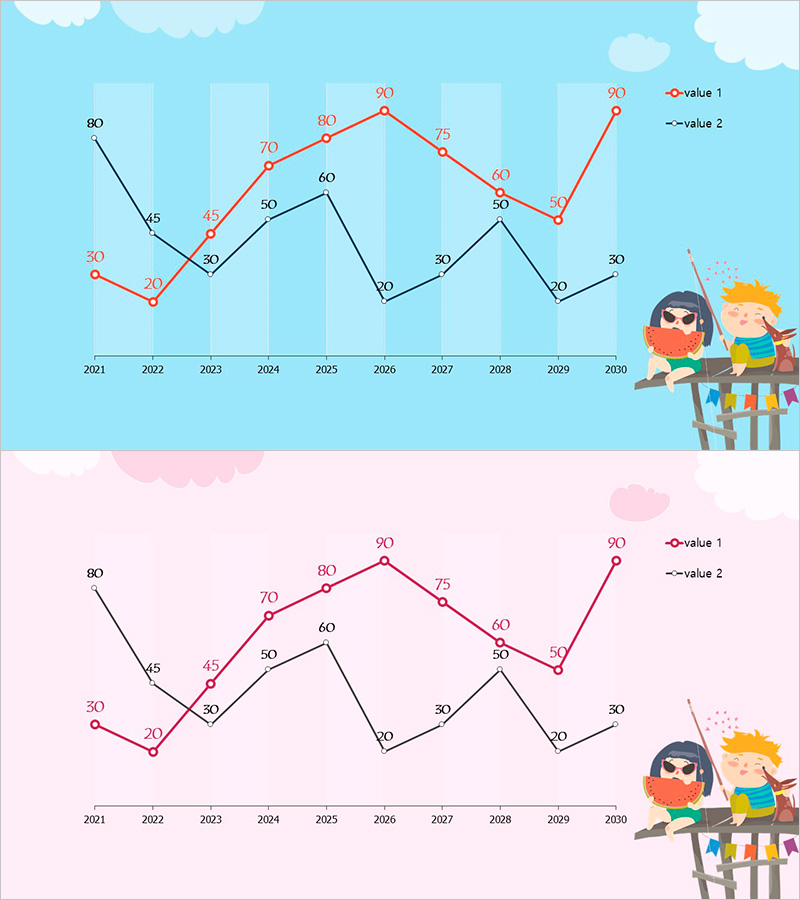
A PowerPoint slide featuring a dual-series line chart tracking data changes from 2021 to 2030 across two distinct metrics. The design uses a light sky-blue background with red and black line series intersecting at ten data points, each labeled with numerical values. A playful character illustration on the right side adds visual interest to your presentation. This template is ready to use for market analysis, sales performance comparison, goal versus actual tracking, and any scenario requiring simultaneous visualization of two related datasets.
Usage Points
-
Main Usage
Designed to compare two data series over time, enabling audiences to visualize parallel trends and identify correlations. Ideal for presenting sales versus forecast, budget versus actual spend, or any paired metrics requiring temporal analysis.
-
How to Use
Open the slide and replace the existing data points and numerical values with your own statistics. The red and black color scheme can be retained or customized to match your brand. The year range is fully adjustable, and the character illustration can be removed or repositioned as needed.
-
Recommended For
Marketing managers, sales directors, financial analysts, project managers, and business consultants presenting quarterly or annual performance reviews, competitive benchmarking, market trend analysis, and strategic forecasting. Also suitable for educators comparing student performance metrics over academic periods.
-
Slide Structure
Two-slide set. The first slide features a sky-blue background with two intersecting line series (red and black) connecting ten data points spanning 2021–2030, with values ranging from 20 to 90. The second slide repeats the identical structure on a pink background, providing a color variation option.
Related Products
-

Camping Market Future Outlook Graph
#Market and Competitor Analysis #Graph #Future Outlook
-

Paint Splash Template Line Chart - Successful Business Strategy
#Business Strategy #Market and Competitor Analysis #Graph
-

Origami Presentation Template Section Line Graph – Market and Performance Analysis
#Market and Competitor Analysis #Financial Plans and Performance #Graph
-

Car Wide Template Line Chart – Market and Competitive Analysis
#Business Introduction #Market and Competitor Analysis #Graph
