Travel Business Trends and Future Prospects - Strategies for Revenue Growth
RJ0500046_16
- Last Update 06/20/2025
- File Size 0.2MB
- # of Slides 2
- File Format PPTX
- Slide Ratio 16:9
- Color
Keywords
- #Content-Based Slides
- #Design-Based Slides
- #Business Introduction
- #Business Strategy
- #Graph
- #Financial Outlook & Expected Impact
- #Column
- #Segmented Column
- #16:9
- #vertical bar chart PowerPoint
- #stacked bar graph template
- #year-over-year trend slide
- #multi-series data visualization
- #business revenue chart
About the Product
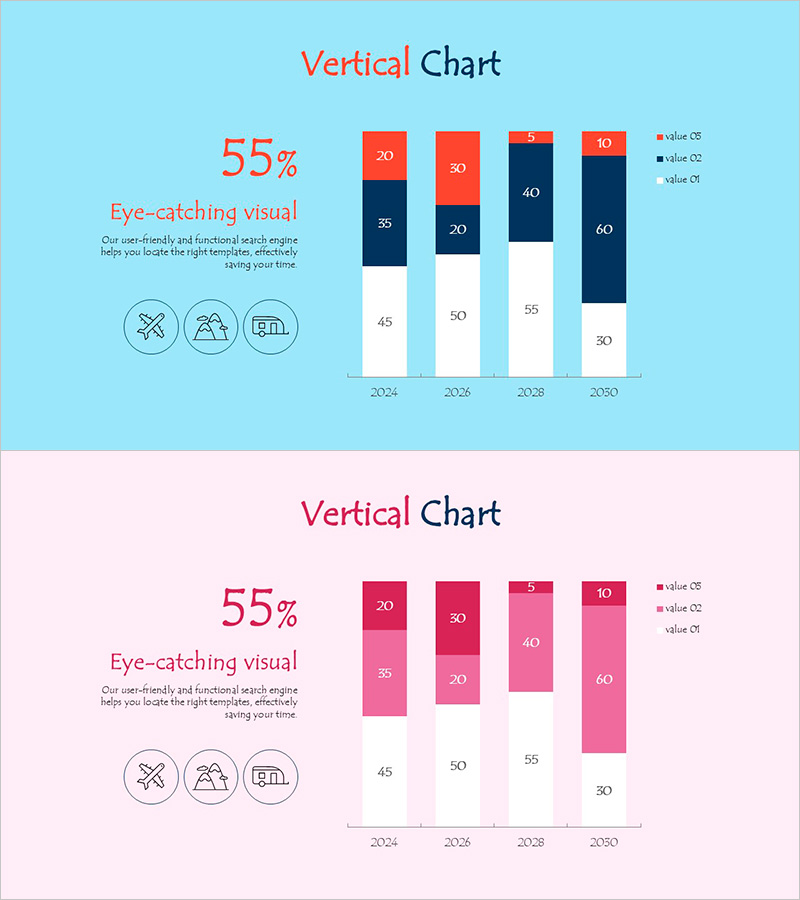
A vertical stacked bar chart PowerPoint slide visualizing travel business revenue trends across four years (2024–2030) with three data series. Set against a light sky-blue background, the chart uses orange, navy, and gray color segments to represent cumulative values for each year. The left side features a 55% statistic with three supporting icons to emphasize key insights. This slide is ready for immediate use in business presentations, annual reports, and industry analysis documents.
Usage Points
-
Main Usage
Compares year-over-year revenue trends, growth rates, and multi-series data for travel, tourism, and hospitality industries. Supports data-driven decision-making in business reports, investor presentations, and executive briefings.
-
How to Use
Open the slide and modify the bar heights and color segments with your own data. Update the year labels, series names, and numerical values, then refresh the legend. Background colors, icons, and text positions are fully editable for customization.
-
Recommended For
Ideal for executives, planning teams, and marketing departments in travel, tourism, hospitality, and airline industries presenting business trends and performance reports. Also suitable for consulting firms, financial institutions, and government agencies conducting industry analysis.
-
Slide Structure
Title area at top + left-side statistics box (55% figure with 3 icons) + right-side vertical stacked bar chart (4 years × 3 data series in cumulative format). Each bar is layered in orange, navy, and gray segments above a white baseline, with legend positioned in the upper right.
Related Products
-

Effectively Visualized Slide of Business Trends
#Business Introduction #Business Strategy #Diagram
-

Geometry PPT Template Wide Vertical bar segmentation graph
#Business Introduction #Business Strategy #Graph
-

Profitability Outlook Breakdown Graph – Future Predictions and Strategies
#Business Strategy #Market and Competitor Analysis #Graph
-

Expected Effect Diffusion Diagram – Visualizing Strategy and Vision
#Business Introduction #Business Strategy #Diagram
