Business Expected Effects Introduction Slide - Practical Business Impact
RM0200014_11
- Last Update 02/05/2025
- File Size 2.3MB
- # of Slides 2
- File Format PPTX
- Slide Ratio 16:9
- Color
Keywords
- #Content-Based Slides
- #Design-Based Slides
- #Business Introduction
- #Business Strategy
- #Diagram
- #Business Areas
- #Financial Outlook & Expected Impact
- #Cluster
- #Closed Cluster Diagram
- #16:9
- #expected effects diagram PowerPoint
- #business impact slide template
- #icon diagram presentation
- #4-item structure slide
- #dark background business slide
About the Product
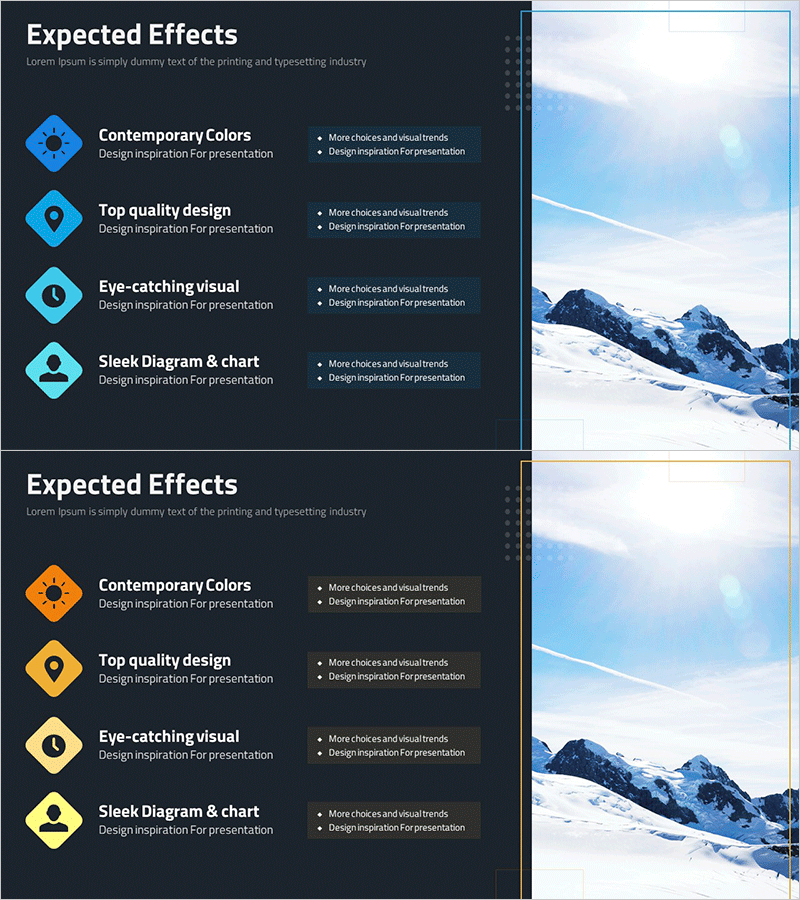
A professional PowerPoint slide that visualizes business expected effects across four key items using diamond-shaped icons on a dark background. The design combines bright cyan and orange accent colors to highlight each effect, making it ideal for investment pitches, business plans, and performance reports. The 2-slide set includes color variations (cyan and orange versions) allowing you to match your presentation theme. Each icon is paired with text space for describing specific outcomes such as revenue growth, cost reduction, market expansion, or customer satisfaction.
Usage Points
-
Main Usage
Clearly communicate business expected effects and anticipated outcomes by structuring them into four core items. The combination of icons and text enhances audience comprehension and visually reinforces your presentation narrative.
-
How to Use
Insert this slide in the expected effects section of investment pitch decks, business plan presentations, or performance review meetings. Replace placeholder text with specific outcomes (revenue increase, cost savings, market penetration, customer satisfaction) and select the color version matching your presentation theme.
-
Recommended For
Executives, business development managers, marketing professionals, and consultants presenting business proposals and performance results. Ideal for startup fundraising, new business planning, and organizational change management presentations.
-
Slide Structure
2-slide set with dark background (black/charcoal). Each slide features four diamond-shaped icons arranged vertically on the left side with text space beside each icon. The right side displays a mountain landscape background image. First slide uses cyan icons; second slide uses orange icons for color variation.
Related Products
-

Expected Effect Diffusion Diagram – Visualizing Strategy and Vision
#Business Introduction #Business Strategy #Diagram
-

Business Area Circular Diagram – Visualizing Cluster Information
#Company Introduction #Business Introduction #Diagram
-

Business Area Progress Analysis Circle Graph – Simple and Stylish
#Product/Service Introduction #Business Introduction #Diagram
-

Global Business Area Diagram – Overview of Business Introduction
#Company Introduction #Business Introduction #Diagram
