Visual Trends Presented in a Table Format PowerPoint Slide
RJ0500045_18
- Last Update 06/19/2025
- File Size 0.6MB
- # of Slides 2
- File Format PPTX
- Slide Ratio 16:9
- Color
Keywords
About the Product
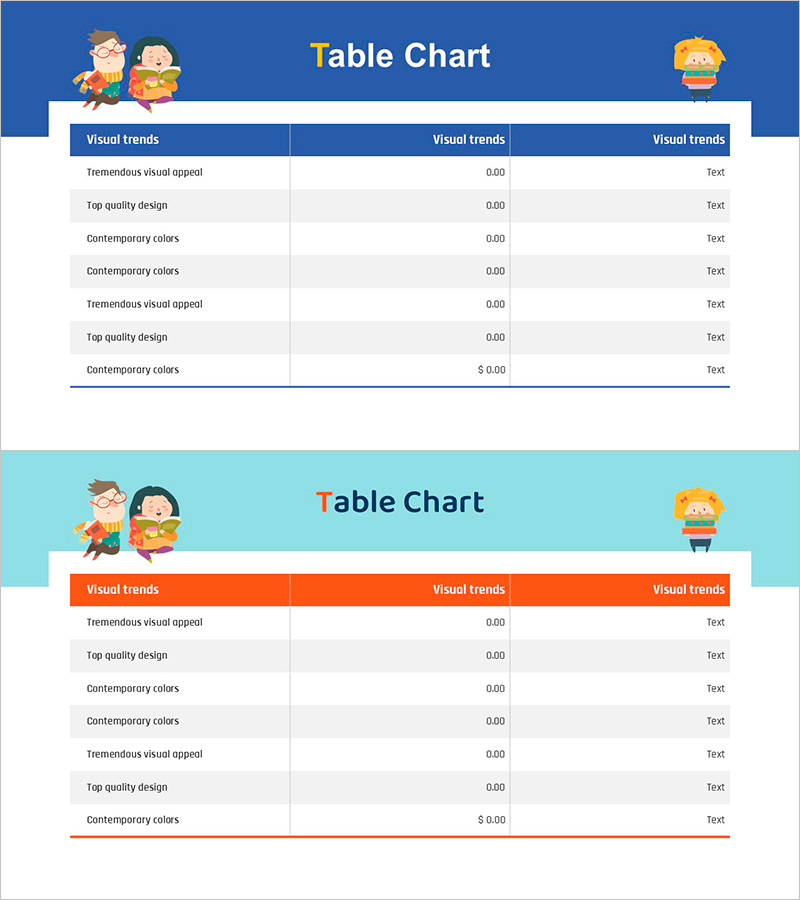
A table-format PowerPoint slide presenting visual trends in a 3-column, 7-row structure. Available in two color versions—navy blue and coral orange—allowing flexible design choices for different presentation contexts. Each cell accommodates text and numerical data, making it ideal for systematic information comparison and analysis. The header row is highlighted in bold color to draw attention. This 2-slide set enables you to select the color scheme that best matches your presentation tone.
Usage Points
-
Main Usage
A table-structured slide that organizes multiple items in rows and columns for data comparison and analysis. Ideal for trend analysis, product comparisons, performance metrics, market research results, and other quantitative information visualization.
-
How to Use
Edit the header row text 'Visual trends' and cell data with your own content. Use the navy blue version for reports requiring credibility and professionalism; choose the coral orange version for presentations emphasizing activity and positivity. Optimized for 16:9 widescreen display.
-
Recommended For
Marketing plans, business reports, product comparison presentations, market analysis materials, performance evaluation slides, educational seminar content, and data-driven sections. Recommended for planners, analysts, educators, and business professionals presenting comparative data.
-
Slide Structure
3-column (Visual trends × 3) by 7-row layout with a bold navy blue or coral orange header row. Each cell is divided into text input and numerical data areas, with consistent row spacing for optimal readability and professional appearance.
Related Products
-

Visualizing Key Financial Indicators with Diagram Presentation
#Financial Plans and Performance #Diagram #Sales and Revenue
-

Structure Presentation Template Segmented Vertical Bar Graph – Market Trends and Performance Analysis
#Market and Competitor Analysis #Financial Plans and Performance #Diagram
-

KPI Target vs Actual Slide – 4-Metric Dark Red & Purple
#Company Introduction #Business Strategy #Financial Plans and Performance
-

Sales and Bills Slide for Navigation App
#Financial Plans and Performance #Diagram #Income Statement
