VR Education Template Share Chart
RJ0500044_9
- Last Update 06/19/2025
- File Size 0.4MB
- # of Slides 2
- File Format PPTX
- Slide Ratio 16:9
- Color
Keywords
- #Content-Based Slides
- #Design-Based Slides
- #Product/Service Introduction
- #Market and Competitor Analysis
- #Graph
- #Development Status
- #Market Share
- #Circles
- #Doughnut Chart
- #16:9
- #donut chart PowerPoint
- #pie chart slide template
- #market share visualization
- #proportional data chart
- #donut graph presentation
About the Product
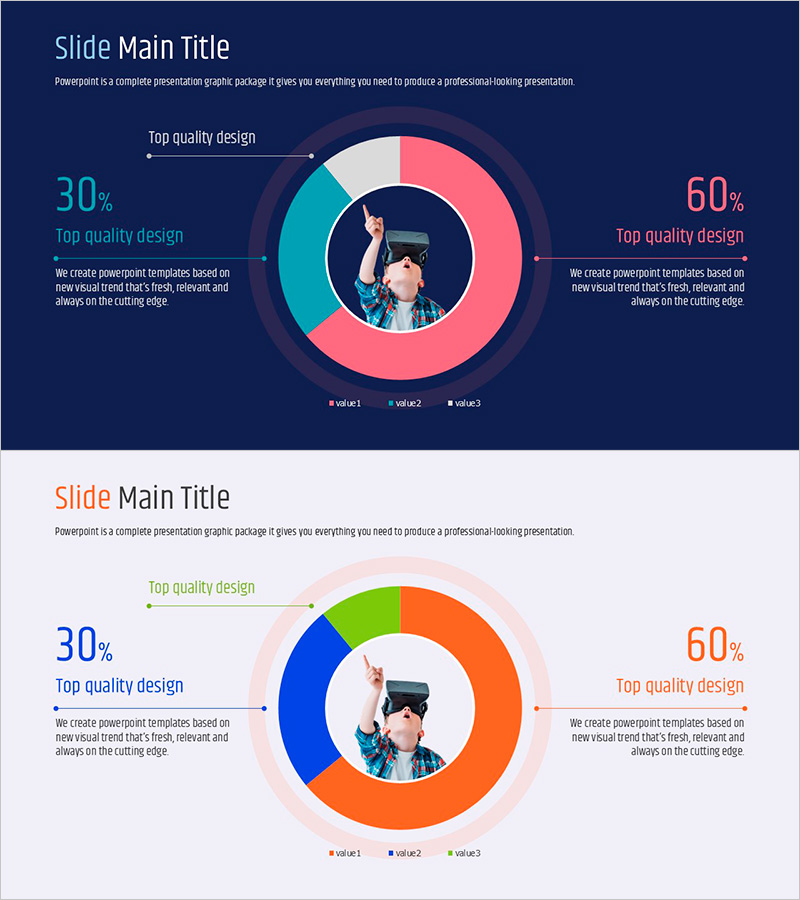
A professional donut chart PowerPoint slide designed to visualize VR education market share and proportional data. Features a dark blue background with pink, cyan, and white color segments, a central circular image area, and left-right text layout for clear data representation. The 2-slide set includes both dark and light background versions, each with percentage emphasis (30%, 60%) and descriptive text zones. Ideal for educational institutions, technology companies, and marketing teams presenting market analysis, customer composition, budget allocation, and revenue distribution in presentations and reports.
Usage Points
-
Main Usage
Designed to represent market share, customer composition, budget allocation, and revenue distribution as proportions of a whole using a donut chart format. The central image area accommodates icons or illustrations to emphasize the topic, while left-right text zones display percentages and descriptions to support data interpretation.
-
How to Use
Apply to VR education market analysis, technology company customer segmentation, educational institution enrollment presentations, and marketing team channel-based revenue reporting. Edit segment colors and percentages to match actual data, and replace the central image area with topic-relevant visuals or icons for customization.
-
Recommended For
Recommended for educators, IT and technology company marketing teams, market analysts, investment professionals, and business planners presenting market conditions, competitive comparisons, and customer segmentation. Particularly suited for reports, proposals, and investor presentations requiring intuitive proportional data communication.
-
Slide Structure
2-slide set featuring dark blue background and light background versions. Each slide contains a 3-segment donut chart (e.g., pink 60%, cyan 30%, white 10%), left-right text zones, and a central circular image insertion area for topic-related icons or photographs.
Related Products
-

Sales Status Analysis Graph – Simple and Stylish Design
#Product/Service Introduction #Market and Competitor Analysis #Graph
-

Map Donut Graph for Visualizing Market Share – Symbol of Practicality and Change
#Product/Service Introduction #Market and Competitor Analysis #Graph
-

Space Exploration Donut Pie Chart
#Product/Service Introduction #Market and Competitor Analysis #Graph
-

Development Status Analysis Donut Chart – Market Share Visualization
#Product/Service Introduction #Market and Competitor Analysis #Graph
