Visualization of Learning Objectives Achievement Rate – No Goals and Growth
RJ0500043_5
- Last Update 06/19/2025
- File Size 1.3MB
- # of Slides 2
- File Format PPTX
- Slide Ratio 16:9
- Color
Keywords
About the Product
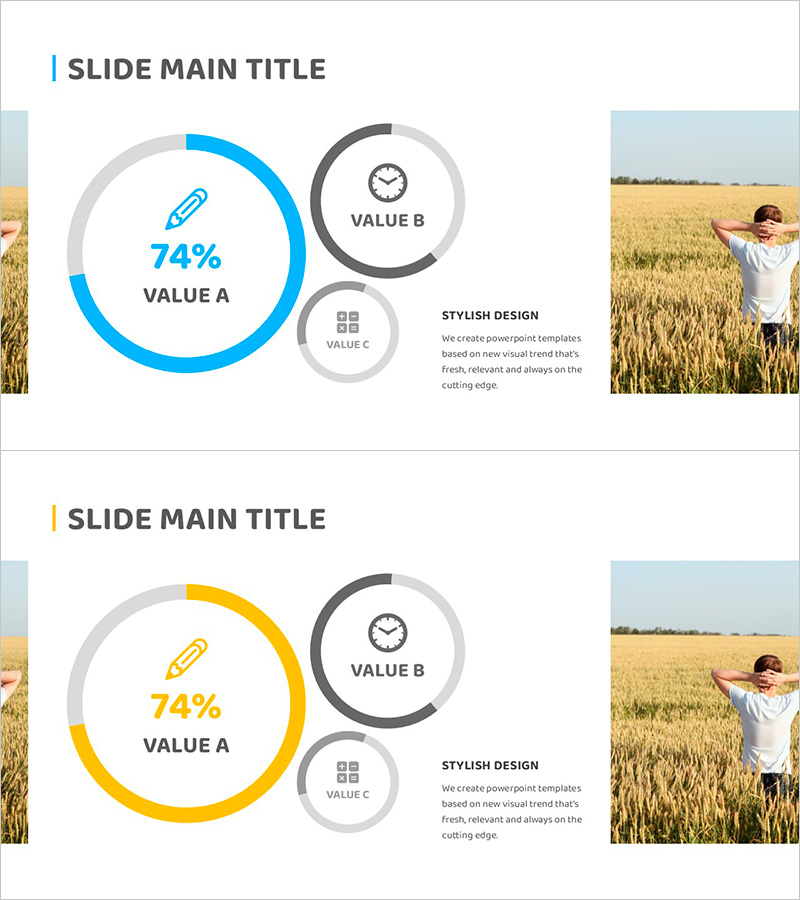
A donut chart PowerPoint slide designed to visualize learning objectives achievement rates, business performance metrics, and strategic progress. The layout features a large central donut chart (74% primary indicator) paired with two supplementary circular elements on the right, creating a hierarchical data comparison structure. Available in two color variations—blue and yellow tones—with balanced composition of image space on the left and descriptive text on the right. This 16:9 widescreen 2-slide template is ready for immediate editing and presentation use.
Usage Points
-
Main Usage
Ideal for presenting learning achievement rates, business performance indicators, strategic progress, and goal-versus-actual metrics. The combination of a prominent central donut chart and supplementary circular elements enables multi-layered data storytelling and comparative analysis across primary and secondary metrics.
-
How to Use
Place a relevant image or photograph on the slide's left side. Input your primary performance metric (e.g., 74%) into the central donut chart. Add supplementary indicators (time, items, counts) to the right-side circular elements, and complete the slide by adding descriptive text in the bottom text area.
-
Recommended For
Educational institutions reporting learning outcomes, corporate presentations of business goal achievement, marketing teams analyzing campaign performance, project managers presenting progress updates, and executive dashboards displaying key performance indicators.
-
Slide Structure
2-slide set. Each slide contains a left image area (approximately 40%), a central donut chart (1 primary chart with 74% display), 2 supplementary circular elements on the right (VALUE B and VALUE C), and a bottom text description area. Two color scheme versions provided: blue tone and yellow tone.
Related Products
-

Business Goals and Areas Electronics Mockup – Vision and Strategy
#Business Introduction #Business Vision and Strategy #Diagram
-

Progress Status Order Circle Graph – Visualizing Project Progress
#Product/Service Introduction #Business Introduction #Diagram
-

Manufacturing Donut Circle Chart – Visual Data Representation
#Product/Service Introduction #Business Introduction #Graph
-

Doughnut Chart for Financial Performance Visualization – Current Technology Status
#Business Introduction #Financial Plans and Performance #Diagram
