Doughnut Chart Slide Visualizing Service Trends and Development Status
RJ0400028_7
- Last Update 05/25/2025
- File Size 1MB
- # of Slides 2
- File Format PPTX
- Slide Ratio 16:9
- Color
Keywords
About the Product
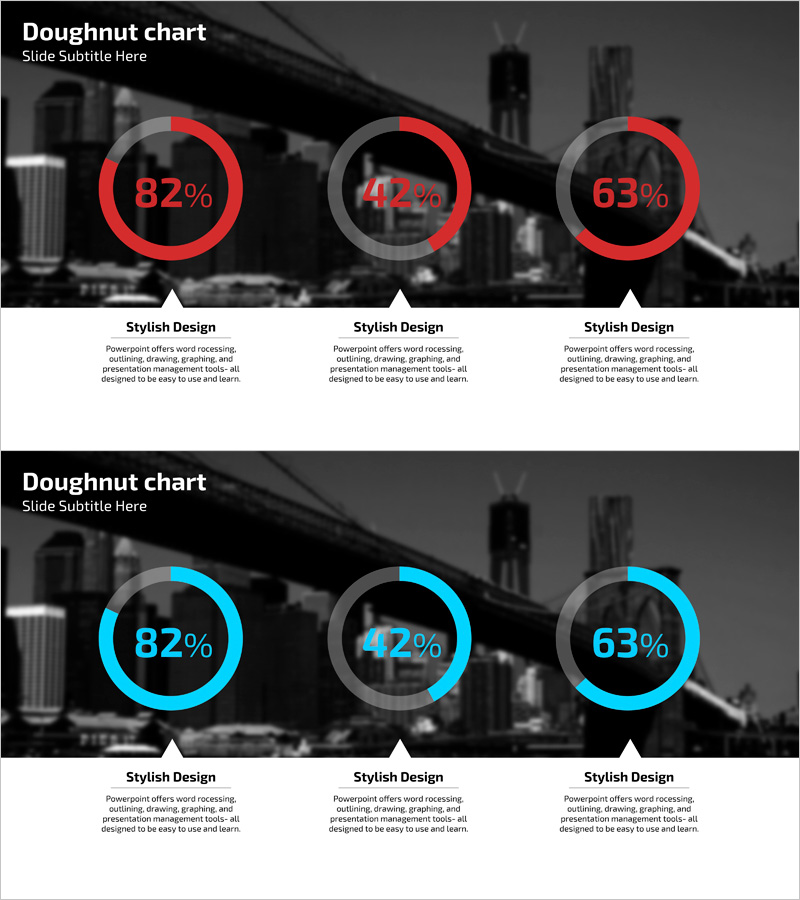
A doughnut chart PowerPoint slide that compares service trends and development status across three items with intuitive visual representation. The circular chart uses red and blue dual-tone colors to display each item's proportion, positioned over a dark cityscape background to enhance business presentation professionalism. The 2-slide set presents multiple data visualization approaches and is optimized for 16:9 widescreen format. This PPT template for expressing numerical data in circular structure is ready to use for marketing, planning, and strategy presentations.
Usage Points
-
Main Usage
Expresses and compares proportional data across three items such as service trends, development status, and market share using circular doughnut charts. The doughnut structure allows additional information to be inserted in the center for multi-layered data representation.
-
How to Use
Used in marketing strategy presentations, business status reports, and product performance analysis to visualize the composition of numerical data. Each item's percentage can be input and the circular proportions automatically adjust accordingly.
-
Recommended For
Recommended for marketing teams analyzing campaign performance, planning teams presenting strategic initiatives, sales teams reporting market conditions, and executive quarterly performance reviews. Suitable for all business presentations requiring data-driven decision-making.
-
Slide Structure
2-slide set presenting red-accent and blue-accent versions. Each slide features three doughnut charts arranged horizontally with descriptive text areas positioned below. Optimized for 16:9 widescreen ratio.
Related Products
-

Business Project Development Status Analysis Graph
#Product/Service Introduction #Business Introduction #Graph
-

Automotive Technology Revenue Model Analysis Chart – Modern and Sleek Design
#Product/Service Introduction #Business Introduction #Diagram
-

Manufacturing Donut Circle Chart – Visual Data Representation
#Product/Service Introduction #Business Introduction #Graph
-

Effective Use of Space Development Donut Circle Graph
#Product/Service Introduction #Business Introduction #Diagram
