Cameras and Horizontal Segmentation Charts – Market Trends and Business Strategy
RJ0500021_12
- Last Update 06/12/2025
- File Size 0.9MB
- # of Slides 2
- File Format PPTX
- Slide Ratio 16:9
- Color
Keywords
- #Content-Based Slides
- #Design-Based Slides
- #Business Strategy
- #Market and Competitor Analysis
- #Graph
- #Industry Trends
- #Horizontal Bar
- #Segmented Horizontal Bar
- #Project Progress
- #16:9
- #100% stacked horizontal bar chart
- #cumulative percentage chart PowerPoint
- #market trend analysis slide
- #4-series data visualization
- #how to create stacked bar chart in PowerPoint
About the Product
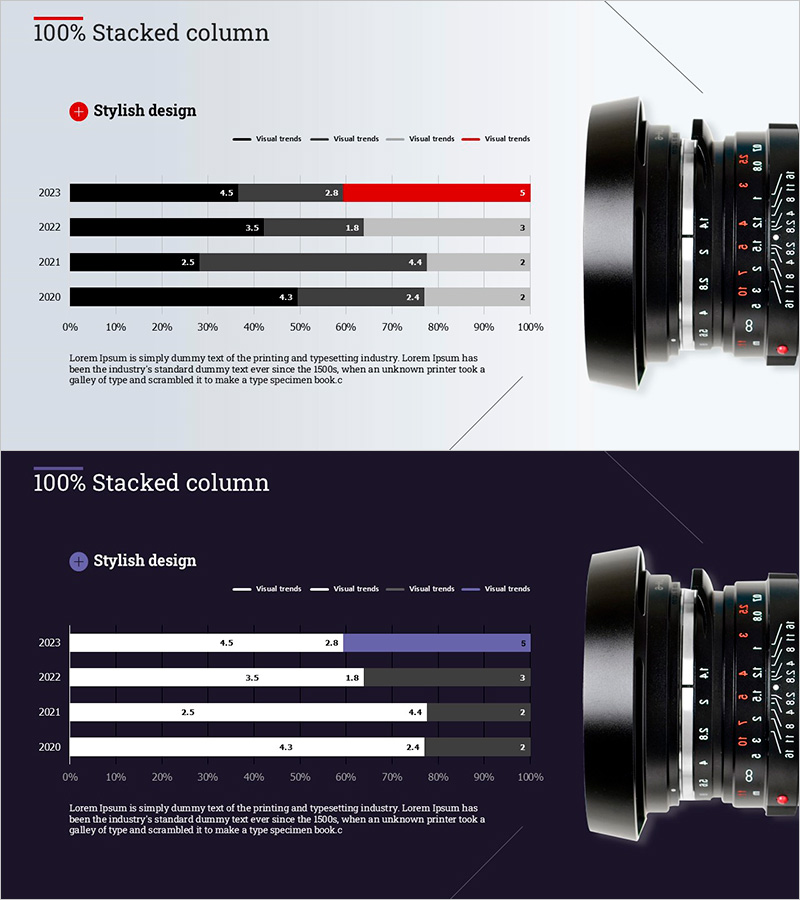
A 100% stacked horizontal bar chart PowerPoint slide designed to visualize market trends and business strategy. The slide displays four data series from 2023 to 2020 in cumulative percentage format, using distinct color schemes—black, gray, and red on light background; white, lavender, and red on dark background—to clearly show the change trajectory of each category. The 2-slide set includes both light and dark background versions for flexible presentation environments. Paired with camera product imagery, this slide is ready to use in market analysis reports, industry trend presentations, and strategic business briefings.
Usage Points
-
Main Usage
Compares year-over-year market share, product category ratios, and business segment composition changes using cumulative percentages. Effectively displays four data series simultaneously while maintaining clarity of overall proportional relationships.
-
How to Use
Insert into market analysis reports, business progress presentations, and product portfolio strategy discussions. The camera imagery is pre-positioned for product market analysis sections. Edit the legend and data labels to input your actual market data and customize the chart for your specific analysis.
-
Recommended For
Marketing managers, business planning teams, executives preparing strategic reports, market research analysts, and product strategy specialists explaining market dynamics and competitive positioning.
-
Slide Structure
2-slide set featuring one 100% stacked horizontal bar chart per slide, four-series legend, year-by-year data labels (2023–2020), and camera product image. Light background version uses black, gray, and red; dark background version uses white, lavender, and red accent colors.
Related Products
-

Horizontal Bar Segmentation Graph for Market Trend Analysis – Establishing Business Strategy
#Business Strategy #Market and Competitor Analysis #Graph
-

Bar Graph Analysis for Business Strategy – Market Diagnosis
#Business Strategy #Market and Competitor Analysis #Graph
-

100% Stacked Bar Chart Abstract Pattern Presentation
#Market and Competitor Analysis #Graph #Other
-

Quarterly Analysis Bar Chart for Real Estate Volume
#Market and Competitor Analysis #Graph #Industry Trends
