Horizontal Bar Chart for Learning Method Survey Analysis – Strategic Approach
RJ0500041_22
- Last Update 06/18/2025
- File Size 0.3MB
- # of Slides 2
- File Format PPTX
- Slide Ratio 16:9
- Color
Keywords
- #Content-Based Slides
- #Design-Based Slides
- #Market and Competitor Analysis
- #Marketing Plan and Strategy
- #Graph
- #Market Analysis
- #Key Marketing Activities
- #Horizontal Bar
- #Horizontal Bar Chart
- #16:9
- #horizontal bar chart PowerPoint
- #survey analysis slide
- #comparison graph template
- #learning method analysis PPT
- #marketing strategy chart
- #data visualization presentation
About the Product
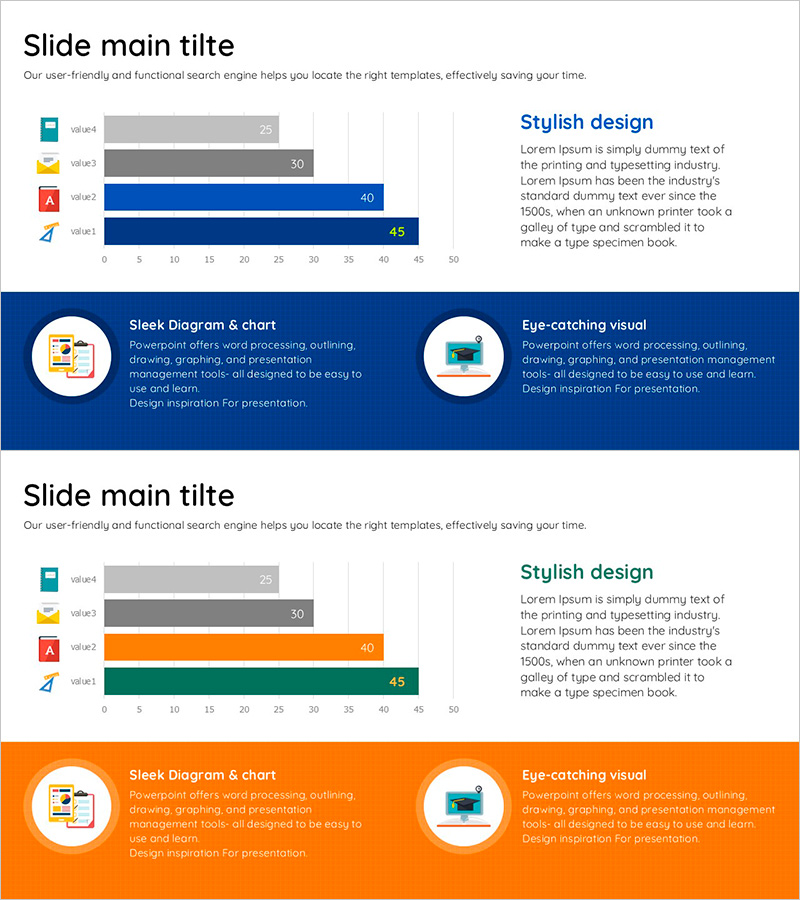
A PowerPoint slide featuring a 4-item horizontal bar chart designed to visualize survey results on learning methods and comparative analysis. Each item is displayed as a horizontal bar, making it easy to compare values across categories for marketing strategy, market analysis, and evaluation presentations. The slide is fully editable in PowerPoint format with color-coded bars to distinguish each item clearly. Ideal for survey data visualization, competitive analysis, and ranking presentations in business reports and strategic planning documents.
Usage Points
-
Main Usage
Visualizes survey results, market data, and evaluation metrics across 4 items using horizontal bars to display rankings and differences at a glance. Effectively supports marketing strategy development, competitive analysis, and evidence-based decision-making in business presentations.
-
How to Use
Input your data values and the horizontal bars automatically adjust to reflect the numbers. Customize colors to match your brand identity and modify titles and labels to fit different survey topics. Present each item's significance during the presentation to enhance audience comprehension and engagement.
-
Recommended For
Recommended for marketing professionals, strategy planners, educators, market analysts, and executives preparing business reports. Suitable for business plans, marketing proposals, market analysis reports, educational seminars, and management meeting presentations.
-
Slide Structure
2-slide set with the first slide featuring a blue-toned 4-item horizontal bar chart and the second slide displaying the same structure in orange tones. Each slide includes a title area, descriptive text field, and 4 data input fields. Optimized for 16:9 widescreen format with professional layout and clear visual hierarchy.
Related Products
-

Stylish Bar Chart Slide Design
#Market and Competitor Analysis #Diagram #Graph
-

Key Performance Bar & Line Analysis Chart – Integrated Market Performance Visualization
#Company Introduction #Market and Competitor Analysis #Graph
-

Competitor and Market Analysis Slide – Pink & Bluegreen PowerPoint Template
#Market and Competitor Analysis #Graph #Competitor Analysis
-

Vertical Bar Chart for Performance Visualization – Trust and Innovation
#Product/Service Introduction #Market and Competitor Analysis #Diagram
