Surveys on Crisis and Help – Intuitive Data Visualization
RJ0500040_25
- Last Update 06/18/2025
- File Size 0.9MB
- # of Slides 2
- File Format PPTX
- Slide Ratio 16:9
- Color
Keywords
About the Product
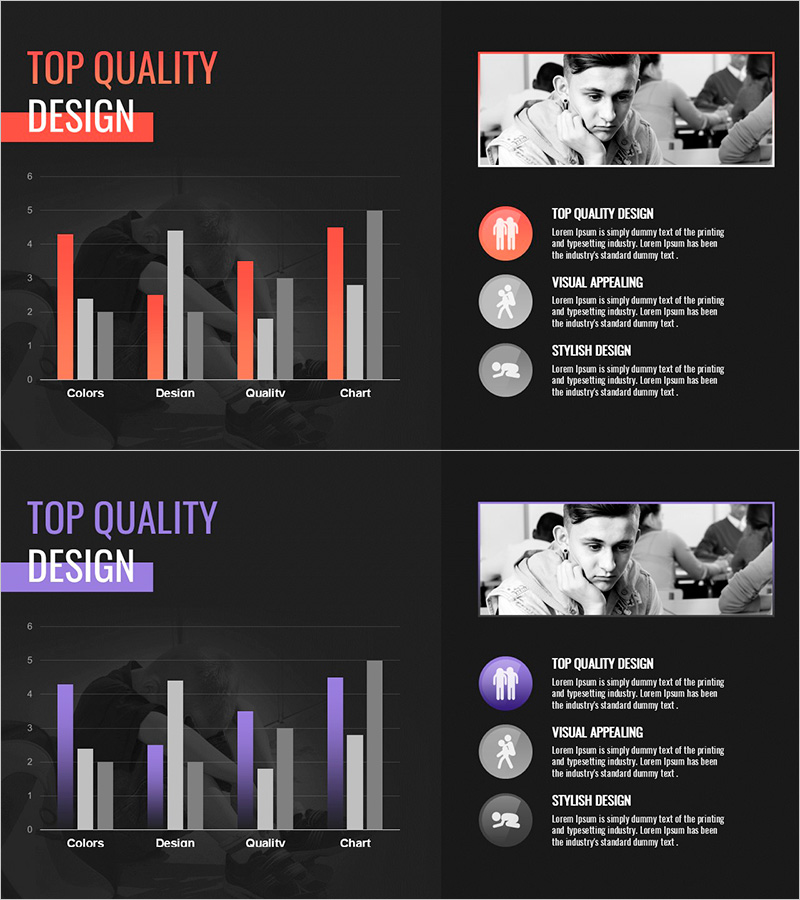
A 2-slide PowerPoint presentation visualizing survey data on crisis and support through grouped bar charts. Dark background with red and gray bar clusters comparing four metrics (Colors, Design, Quality, Chart) for intuitive data analysis. Left-side graph area paired with right-side text and icon section in a two-column layout enables simultaneous presentation of data results and key insights. PPTX format in 16:9 widescreen ratio, fully editable and ready for market research, customer analysis, business reports, and stakeholder presentations.
Usage Points
-
Main Usage
Present survey results, market research, and customer analysis data through side-by-side bar comparison. The grouped bar chart enables viewers to instantly grasp relative values and trends across four metrics, while the right-side icon section explains each category's significance.
-
How to Use
Insert into business reports, marketing presentations, and customer satisfaction analysis decks as your data visualization section. Replace chart values with your own data and populate the right-side text area with analysis findings, insights, and recommendations. Use red accent color to emphasize critical metrics.
-
Recommended For
Marketing managers, business analysts, strategists, and executives presenting data-driven decisions. Particularly effective for crisis response reporting, customer support evaluation, satisfaction surveys, and converting qualitative feedback into quantifiable metrics.
-
Slide Structure
Two-slide deck with each slide divided into left-side grouped bar chart (Y-axis 0–6, four data series in red and gray alternation) and right-side icon-text section (three circular icon backgrounds with title and description text). Dark background with white typography and red accent lines for emphasis.
Related Products
-

Customer Analysis Bundled Vertical Bar Chart – A Clear View of Market Trends
#Market and Competitor Analysis #Marketing Plan and Strategy #Graph
-

Gender Analysis Chart – Ideal for Market & Customer Analysis
#Market and Competitor Analysis #Financial Plans and Performance #Graph
-

Gender Analysis Graph – Stylish Slide for Customer Analysis
#Market and Competitor Analysis #Marketing Plan and Strategy #Graph
-

Layout Design Presentation Template for Market & Competitor Analysis – Column Chart
#Market and Competitor Analysis #Graph #Customer Analysis
