Customer Analysis Bundled Vertical Bar Chart – A Clear View of Market Trends
RJ0500011_6
- Last Update 06/10/2025
- File Size 4.1MB
- # of Slides 2
- File Format PPTX
- Slide Ratio 16:9
- Color
Keywords
- #Content-Based Slides
- #Design-Based Slides
- #Market and Competitor Analysis
- #Marketing Plan and Strategy
- #Graph
- #Customer Analysis
- #Marketing Strategy
- #Column
- #Grouped Column
- #16:9
- #vertical bar chart PowerPoint
- #bundled column chart template
- #customer analysis slide
- #data comparison chart
- #marketing analysis presentation
About the Product
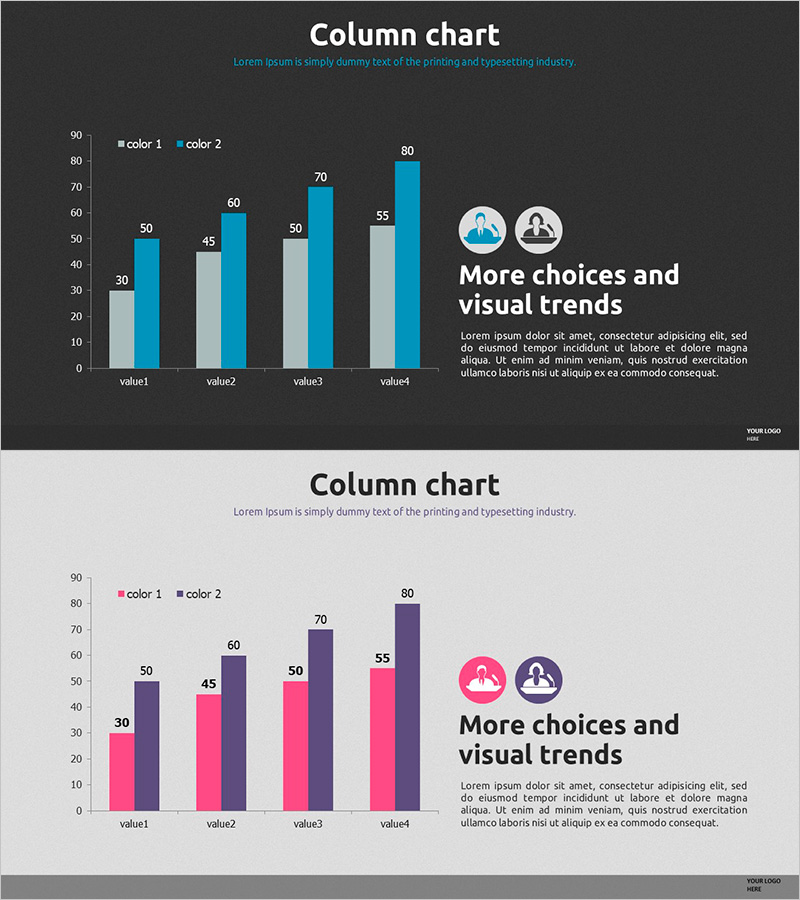
A PowerPoint slide template featuring customer analysis and market trend data visualized through 2-series vertical bar charts. The first slide uses a dark gray background with light blue and gray color schemes to compare four data points, while the second slide employs a light gray background with hot pink and purple color schemes in the same structure. Both slides include legend, data labels, and icon elements to enhance information clarity. This presentation template is ready to use for customer segmentation, competitive benchmarking, marketing performance analysis, and other business scenarios requiring side-by-side numerical comparisons.
Usage Points
-
Main Usage
Optimized for expressing two-series numerical data such as customer segmentation, market share, and competitive performance comparison. Enables clear side-by-side comparison of two metrics per category, providing solid evidence for decision-making.
-
How to Use
Place this slide in marketing strategy presentations, quarterly performance reports, and customer analysis documents within the data comparison section. Select either the dark or light background version to match your presentation tone, then replace the legend and values with your own data.
-
Recommended For
Marketing professionals, sales analytics teams, business executives preparing reports, consulting firms, market research agencies, and data analysts who need to visualize customer data, competitive analysis, and performance metrics.
-
Slide Structure
2-slide set. Slide 1: Dark gray background with light blue and gray 2-series vertical bars for 4 items, including legend, data labels, and icons. Slide 2: Light gray background with hot pink and purple 2-series vertical bars in identical structure. 16:9 widescreen format.
Related Products
-

Survey of Students' Device Utilization – Horizontal Bar Graph Slide
#Market and Competitor Analysis #Graph #Customer Analysis
-

Horizontal Bar Chart Comparison – Presenting Effective Marketing Strategies
#Market and Competitor Analysis #Marketing Plan and Strategy #Graph
-

Study Topic Vertical Bar Graph – Marketing Strategy Analysis
#Market and Competitor Analysis #Marketing Plan and Strategy #Graph
-

Key Customer Analysis Chart – Customer Success Case
#Market and Competitor Analysis #Customer Success Stories #Graph
