Line Chart on Creative Thinking Skills – Competitive Advantage Analysis
RJ0500039_24
- Last Update 06/17/2025
- File Size 0.5MB
- # of Slides 2
- File Format PPTX
- Slide Ratio 16:9
- Color
Keywords
About the Product
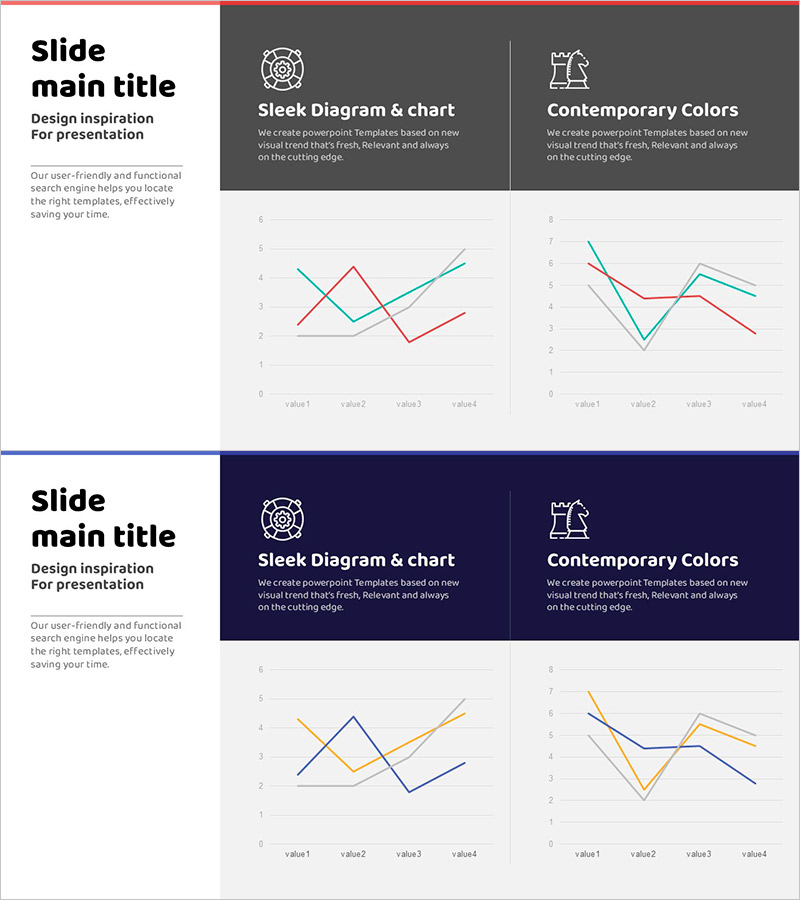
A multi-series line chart PowerPoint slide for analyzing creative thinking skills and competitive advantage. Featuring three color-coded data series (cyan, red, yellow) with four data points each, this slide visualizes numerical trends and performance comparisons across items over time. Delivered in 16:9 widescreen format with 2 slides, it integrates seamlessly into presentations, reports, and analytical materials. The intersection points and rising/falling segments clearly highlight data insights for effective decision-making.
Usage Points
-
Main Usage
Optimized for comparing and analyzing numerical trends across multiple items over time. Ideal for competitive advantage analysis, market trend tracking, and performance metric monitoring where simultaneous visualization of multiple data series is essential for stakeholder understanding.
-
How to Use
Assign each color-coded series to organizations, departments, products, or competitors. Place time periods or categories on the horizontal axis and numerical values on the vertical axis. Emphasize rising and falling segments during presentation to highlight key insights. Use in report sections, analytical discussions, and strategy development phases.
-
Recommended For
Recommended for executives, marketing teams, strategic planners, sales teams, and data analysts requiring data-driven decision-making. Suitable for business plans, quarterly reports, market analysis documents, competitive benchmarking presentations, and performance evaluation materials.
-
Slide Structure
Comprises 2 slides, each displaying 3–4 color-coded line series connecting 4 data points. Title and description area at top, graph area in center, and legend at bottom create clear information hierarchy. 16:9 widescreen format optimizes display on projectors and online presentation platforms.
Related Products
-

Line Chart of the Violence Survey – Market Analysis and Competitive Advantage
#Market and Competitor Analysis #Graph #Market Analysis
-

Learning Goal Deflection Line Graph – Business Strategy
#Business Strategy #Market and Competitor Analysis #Graph
-

Chair Sales Graph – Visual Data Analysis
#Market and Competitor Analysis #Financial Plans and Performance #Graph
-

Competition Graphs and Analysis – Slides for Market Advantage
#Market and Competitor Analysis #Graph #Competitor Analysis
