Accumulated Line Chart – Market and Competitor Analysis
RJ0900026_14
- Last Update 08/23/2025
- File Size 0.5MB
- # of Slides 2
- File Format PPTX
- Slide Ratio 16:9
- Color
Keywords
- #Content-Based Slides
- #Design-Based Slides
- #Market and Competitor Analysis
- #Financial Plans and Performance
- #Graph
- #Competitive Advantage
- #Sales and Revenue
- #Line
- #Line Chart
- #16:9
- #accumulated line chart PowerPoint
- #line graph template download
- #market analysis slide
- #competitor analysis chart
- #trend analysis presentation template
About the Product
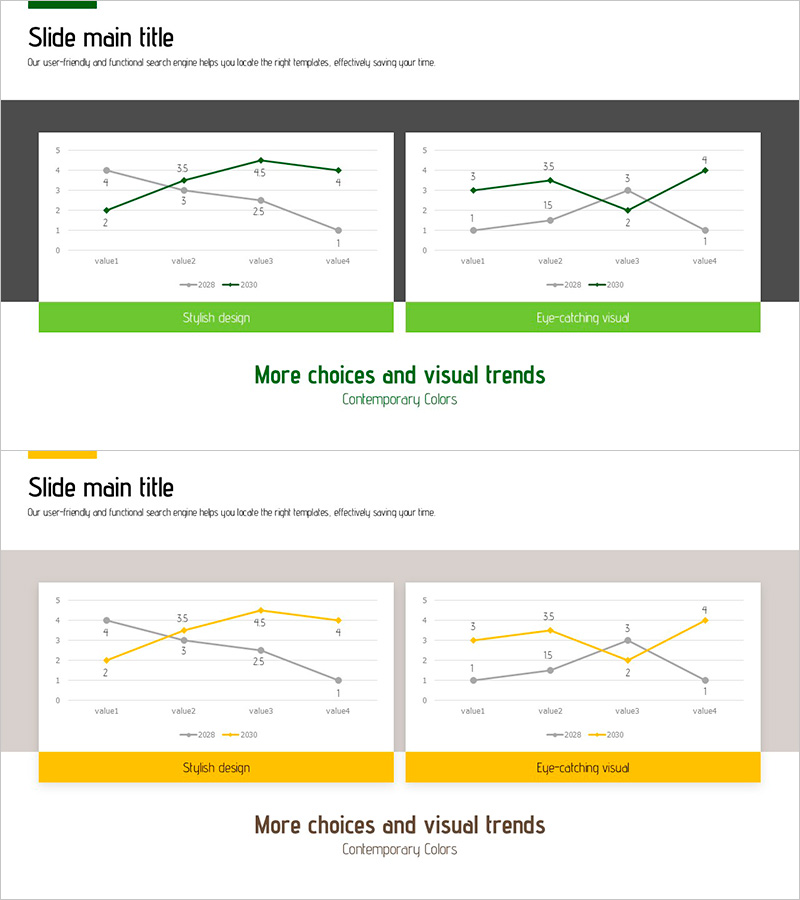
A professional accumulated line chart PowerPoint slide designed for market and competitor analysis presentations. This template visualizes two data series across four time periods using contrasting green and gray tones to distinguish primary market indicators from competitive benchmarks. The dual-series line graph effectively communicates growth trajectories and market shifts in a single visual. Formatted in 16:9 widescreen with 2 fully editable slides ready for immediate use in business reports and strategic presentations.
Usage Points
-
Main Usage
Simultaneously track market size evolution and competitive performance using a dual-series accumulated line graph that reveals relative positioning and trend shifts at a glance. Ideal for financial reports, business analysis, and marketing strategy presentations requiring data-driven evidence.
-
How to Use
Open the slide and replace data points (value1 through value4) with actual figures. Update the legend (2028/2029) to reflect your reporting periods. Assign the green series to your company metrics and gray series to competitor data for comparative analysis.
-
Recommended For
Finance teams presenting quarterly earnings, executive strategy meetings, investor relations presentations, marketing departments analyzing market share, and consulting firms preparing client proposals.
-
Slide Structure
Both slides feature identical layouts with dual-series accumulated line graphs. Each contains 4 data points (value1–value4) and 2 series legend entries (2028/2029). Clear title area at top and labeled axis area at bottom enable quick customization.
Related Products
-

Line Graph Analysis of Textile Market – Gain Competitive Edge
#Market and Competitor Analysis #Financial Plans and Performance #Graph
-

Slide Visualizing Sales Performance Trend in the Kids Market
#Market and Competitor Analysis #Financial Plans and Performance #Graph
-

Garden Management Curve Graph
#Market and Competitor Analysis #Financial Plans and Performance #Graph
-

Graph Analysis by Year Sales
#Market and Competitor Analysis #Financial Plans and Performance #Graph
