Presenting Market Analysis with Blue Pink Line Chart
RJ0500035_22
- Last Update 06/16/2025
- File Size 0.3MB
- # of Slides 2
- File Format PPTX
- Slide Ratio 16:9
- Color
Keywords
- #Content-Based Slides
- #Design-Based Slides
- #Market and Competitor Analysis
- #Risk Management and Regulatory Compliance
- #Graph
- #Competitive Advantage
- # Risk Management Strategy
- #Line
- #Line Chart
- #16:9
- #line chart PowerPoint slide
- #market analysis presentation template
- #dual-series chart design
- #trend analysis PPT
- #competitive analysis slide template
About the Product
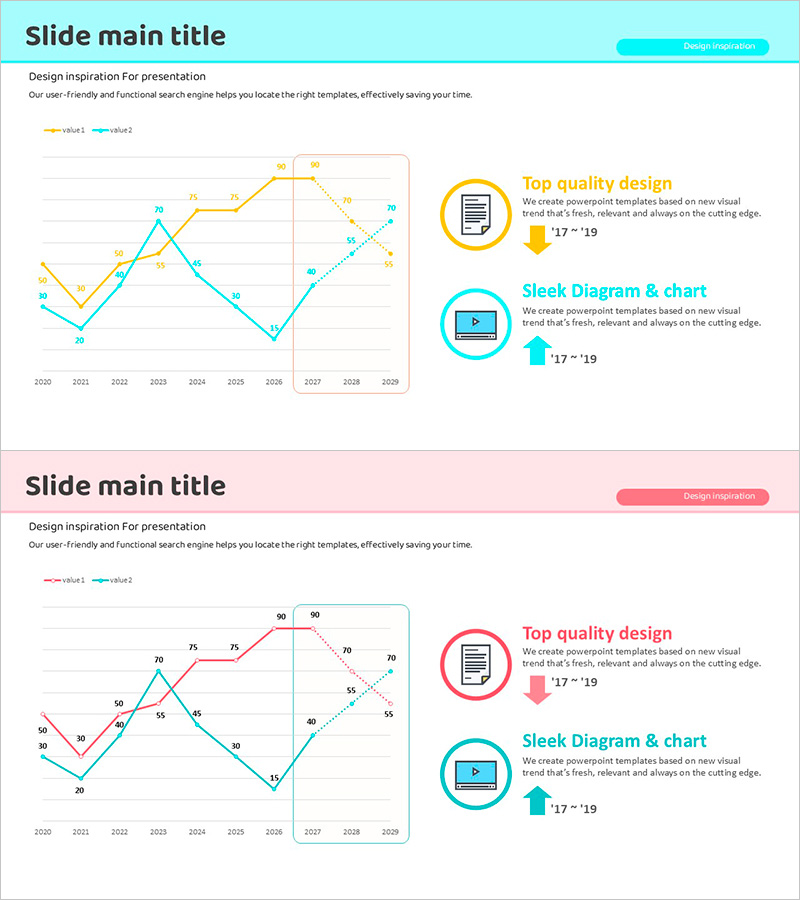
A PowerPoint slide featuring a dual-series line chart in blue and pink to compare market trends over a 10-year period from 2020 to 2029. The chart includes clear data points, gridlines for easy value reading, and two icon-highlighted insight boxes on the right side to emphasize key findings. This presentation slide is ready to use for competitive analysis, market growth comparison, risk factor tracking, and strategic business presentations. The 16:9 widescreen format ensures compatibility with modern displays and projectors.
Usage Points
-
Main Usage
Compare two data series over time—such as company performance versus competitor metrics, positive indicators versus risk factors, or revenue trends across markets. The gridded background and labeled data points ensure numerical accuracy, while the right-side icon boxes highlight critical conclusions for immediate audience understanding.
-
How to Use
Insert this slide into executive reports, investor presentations, strategy meetings, and quarterly business reviews. Assign the blue line to your company's metrics and the pink line to competitor data, or use them to represent growth versus risk indicators. Edit the data points and axis values with your actual figures for immediate deployment.
-
Recommended For
Executives, marketing managers, strategic planners, financial analysts, and sales leaders presenting market analysis, competitive positioning, performance reports, and risk assessments. Ideal for business plans, investor pitch decks, quarterly earnings reports, marketing strategy documents, and risk management presentations.
-
Slide Structure
Two identical slides with a dual-series line chart on the left (blue and pink lines, 10 data points spanning 2020–2029, Y-axis range 0–90) and two icon-highlighted text boxes on the right (yellow icon box above, cyan icon box below). The 16:9 widescreen layout is optimized for modern presentation environments and digital displays.
Related Products
-

Variation Graph for the Line Chart – Optimized Design for Market and Competitor Analysis
#Market and Competitor Analysis #Graph #Competitor Analysis
-

Competitor Analysis Broken Line Graph – Exploring Competitive Advantage in the Market
#Market and Competitor Analysis #Graph #Competitor Analysis
-

Idea Presentation Template Wide Line Chart
#Market and Competitor Analysis #Graph #Industry Trends
-

Triangular Pattern Presentation Template – Business Strategy & Market Analysis
#Business Strategy #Market and Competitor Analysis #Graph
