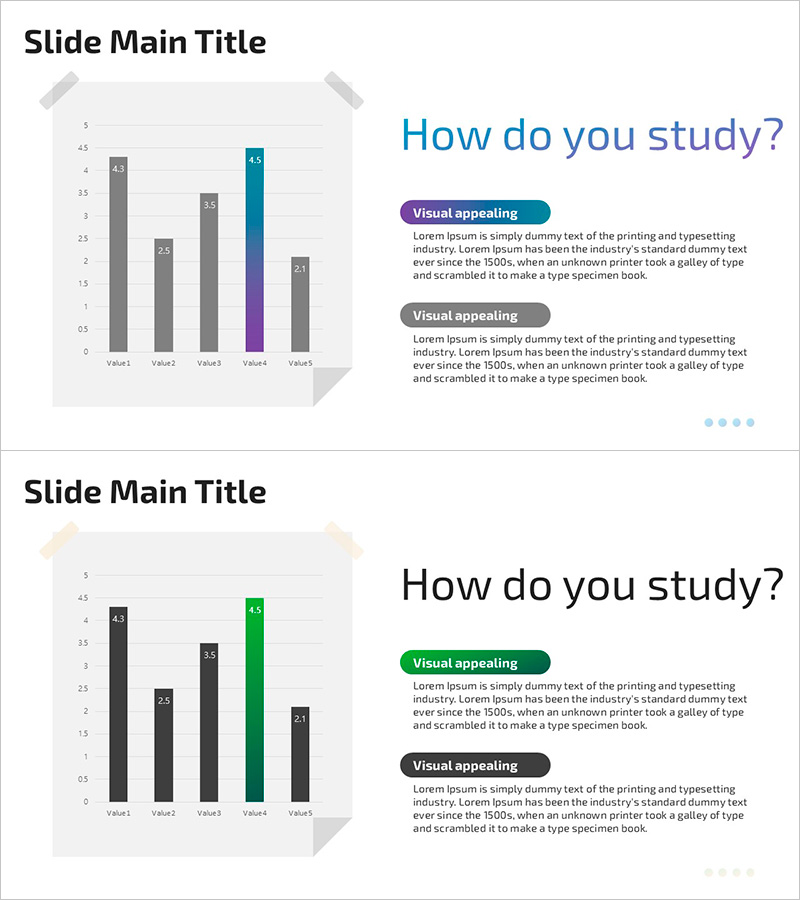
Study Method Survey Graph – Visualizing Study Habits
RJ0500038_7
- Last Update 06/17/2025
- File Size 0.4MB
- # of Slides 2
- File Format PPTX
- Slide Ratio 16:9
- Color
Keywords
About the Product
A 2-slide bar chart PowerPoint template for visualizing study method survey data. The first slide displays a horizontal bar chart comparing 5 items with values ranging from 0 to 5, while the second slide presents a vertical bar chart with 4 items. Multiple colors—gray, blue, green, and purple—distinguish each data series for clear visual comparison. Fully editable and ready to use for educational research presentations, student surveys, learning habit analysis, and academic conferences.
Usage Points
-
Main Usage
Presents quantitative survey data and educational research findings using horizontal and vertical bar charts. Helps audiences quickly understand comparative analysis of study methods, learning habits, and educational effectiveness through intuitive visual representation.
-
How to Use
Slide 1 uses horizontal bars for comparing item values side-by-side; Slide 2 uses vertical bars to emphasize trends. Simply replace the data values and bar colors to match your survey results. All text, numbers, and colors are fully editable in PowerPoint.
-
Recommended For
Education researchers, school administrators, educational consultants, student presenters, and institutional marketing teams presenting study method surveys, learning effectiveness analysis, student satisfaction assessments, and academic research findings.
-
Slide Structure
Slide 1: Horizontal bar chart with 5 data series (0–5 scale, color-coded in gray, blue, green, purple) / Slide 2: Vertical bar chart with 4 data series (0–5 scale, gray and green emphasis). Both include title, legend, and data labels.
Related Products
-

Business Forest Wide Template Line Chart – Highlighting Financial Performance
#Financial Plans and Performance #Graph #Sales and Revenue
-

Purple Brown Market Share Analysis – Emphasizing Visual Appeal
#Market and Competitor Analysis #Graph #Other
-

Comparison of Change Curves – Market and Competitor Analysis
#Market and Competitor Analysis #Graph #Market Status
-

Blue Radar Chart Analysis – Insights for Products and Services
#Product/Service Introduction #Graph #Features
