Donut Chart Slide for Market & Competitive Analysis – Korea's Representative Image Survey
RJ0800030_6
- Last Update 08/08/2025
- File Size 5.8MB
- # of Slides 2
- File Format PPTX
- Slide Ratio 16:9
- Color
Keywords
- #Content-Based Slides
- #Design-Based Slides
- #Business Strategy
- #Market and Competitor Analysis
- #Graph
- #Achievements
- #Market Share
- #Circles
- #Doughnut Chart
- #16:9
- #donut chart PowerPoint slide
- #pie chart template
- #market analysis slide
- #competitive analysis PPT
- #ratio visualization slide
- #how to create donut chart in PowerPoint
About the Product
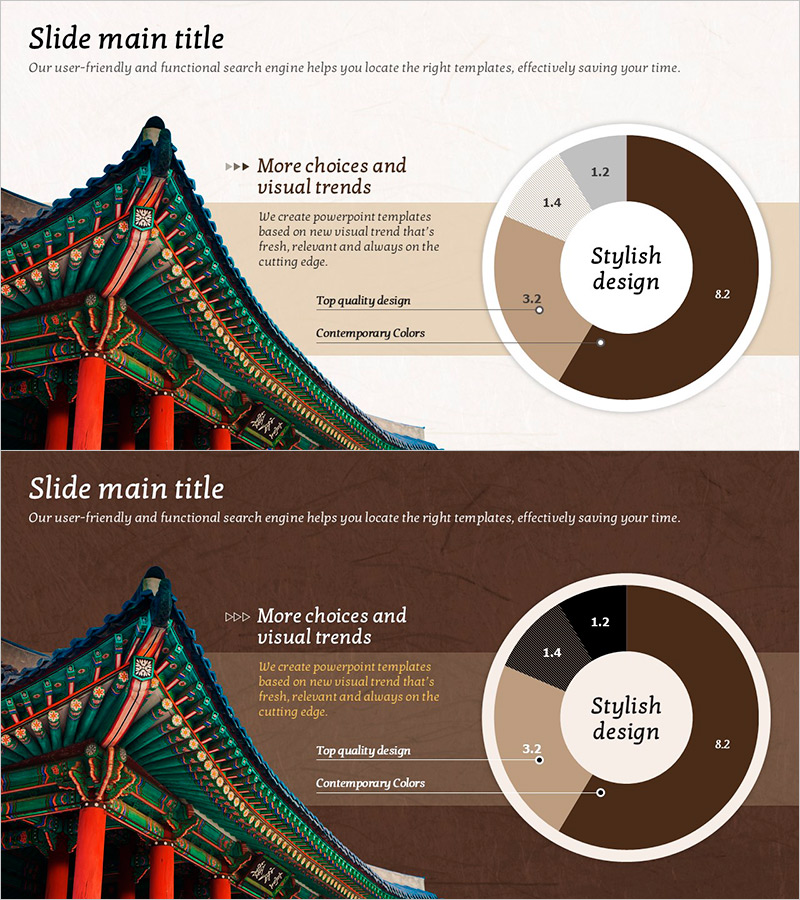
A donut chart PowerPoint slide designed for market and competitive analysis presentations. The slide features a warm color palette of brown, beige, and gray tones, with a central circular area for key messaging and four data segments for visualization. Paired with a representative Korean architectural image, it effectively emphasizes regional characteristics in business presentations. The 2-slide set is optimized for modern 16:9 widescreen formats, allowing flexible data representation across multiple analytical perspectives.
Usage Points
-
Main Usage
Visualizes market share, competitor comparison, customer composition, and revenue distribution as proportional segments. The central circular area highlights key messages, while four distinct segments enable intuitive data comparison and ratio representation.
-
How to Use
Apply to executive reports, business plans, and marketing strategy presentations in the market analysis section. Customize by entering segment values and adjusting colors to match your data. The Korean imagery makes it particularly effective for domestic market analysis and regional business expansion discussions.
-
Recommended For
Marketing teams, strategic planning departments, sales teams, and executives presenting market analysis findings. Ideal for presentations on domestic market entry, regional business expansion, and competitive positioning strategies.
-
Slide Structure
2-slide set with each slide centered on a 4-segment donut chart. Korean architectural imagery is positioned on the left, with legend and descriptive text areas on the right, maintaining visual balance. Provided in 16:9 widescreen format with independently editable segments for color customization and data input.
Related Products
-

Donut Chart for Performance Analysis – Market Share Review
#Business Strategy #Market and Competitor Analysis #Graph
-

Blue Green Progress Visualization – Graph for Achievement Rate
#Product/Service Introduction #Business Strategy #Market and Competitor Analysis
-

Donut Chart and Mobile Mockup – Market Share Analysis
#Business Strategy #Market and Competitor Analysis #Graph
-

Tricolor Media Usage Graph for Market Share Analysis – Successful Business Strategy
#Business Strategy #Market and Competitor Analysis #Graph
