Donut Chart for Performance Analysis – Market Share Review
RJ0600089_28
- Last Update 07/14/2025
- File Size 0.6MB
- # of Slides 2
- File Format PPTX
- Slide Ratio 16:9
- Color
Keywords
- #Content-Based Slides
- #Design-Based Slides
- #Business Strategy
- #Market and Competitor Analysis
- #Graph
- #Achievements
- #Market Share
- #Circles
- #Doughnut Chart
- #16:9
- #donut chart PowerPoint slide
- #pie chart template download
- #market share analysis presentation
- #4-segment donut diagram
- #data visualization PowerPoint
- #how to create donut chart in PowerPoint
About the Product
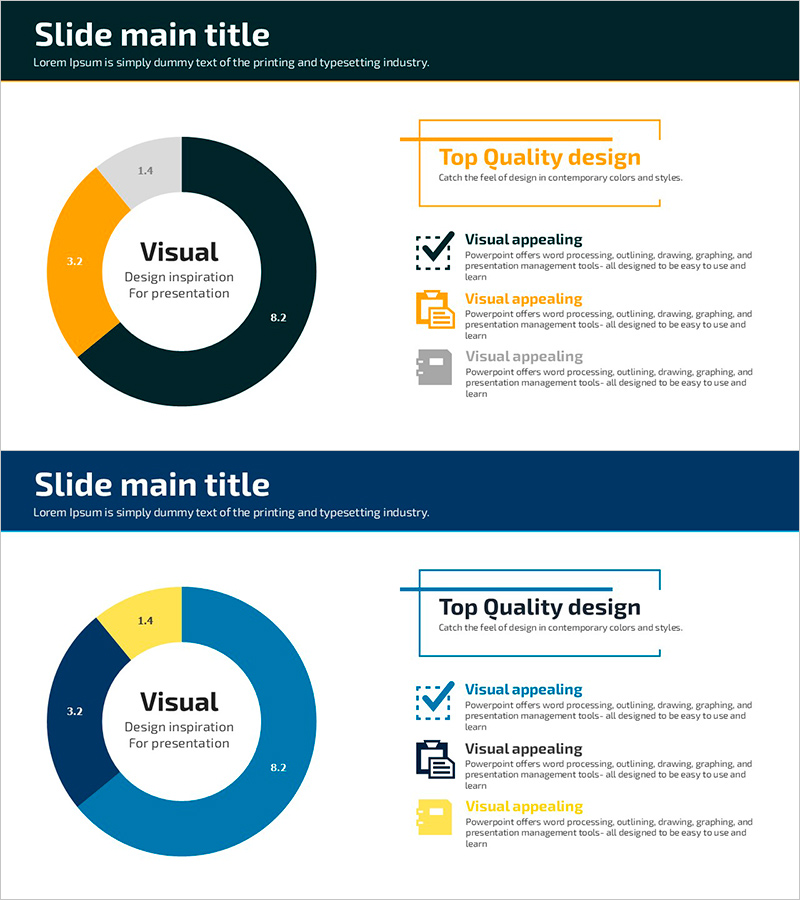
A donut chart PowerPoint slide designed for performance analysis and market share visualization. This presentation template features a 4-segment donut graph in dark navy, orange, and light gray colors with numerical labels for each section, enabling clear data ratio comparison. The right side includes a title box, checkmark icons, and text descriptions to highlight key insights. The 2-slide PPTX template in 16:9 aspect ratio is fully editable and ready for business reports, marketing analysis, and executive presentations.
Usage Points
-
Main Usage
The donut chart visually represents proportions, market share, composition ratios, and segment distribution. It effectively communicates the relationship between parts and the whole, making it ideal for displaying market share, revenue composition, customer distribution, and product category breakdown.
-
How to Use
The 2-slide template includes a standalone donut chart on the first slide and a combined layout with chart, checkmarks, icons, and text descriptions on the second. Edit the segment values and colors to match your data, then add key insights in the text area on the right side.
-
Recommended For
Perfect for executives, marketing teams, sales departments, and finance teams presenting data-driven insights. Use it for quarterly performance reports, market analysis, customer segmentation, product portfolio composition, competitive benchmarking, and any business presentation requiring proportion-based data visualization.
-
Slide Structure
The donut chart consists of a central circular area with 4 color-coded segments, each labeled with numerical values (1.4, 3.2, 8.2, etc.). The right side features a 'Top Quality Design' title box with 3 items displaying checkmark icons and accompanying text descriptions for highlighting key points.
Related Products
-

Holiday Donut Charts – Business Strategy and Performance Analysis
#Business Strategy #Market and Competitor Analysis #Graph
-

Future Target Market Share Donut Chart – Performance and Competitiveness
#Business Strategy #Market and Competitor Analysis #Graph
-

Donut Chart and Mobile Mockup – Market Share Analysis
#Business Strategy #Market and Competitor Analysis #Graph
-

Donut Chart Slide for Market & Competitive Analysis – Korea's Representative Image Survey
#Business Strategy #Market and Competitor Analysis #Graph
