System Vertical Bundled Chart Analysis
RJ0500038_22
- Last Update 06/17/2025
- File Size 0.4MB
- # of Slides 2
- File Format PPTX
- Slide Ratio 16:9
- Color
Keywords
- #Content-Based Slides
- #Design-Based Slides
- #Market and Competitor Analysis
- #Graph
- #Competitor Analysis
- #Column
- #Grouped Column
- #16:9
- #vertical bundled bar chart PowerPoint
- #grouped column chart slide template
- #market analysis presentation
- #competitive comparison slide
- #data visualization PPT download
About the Product
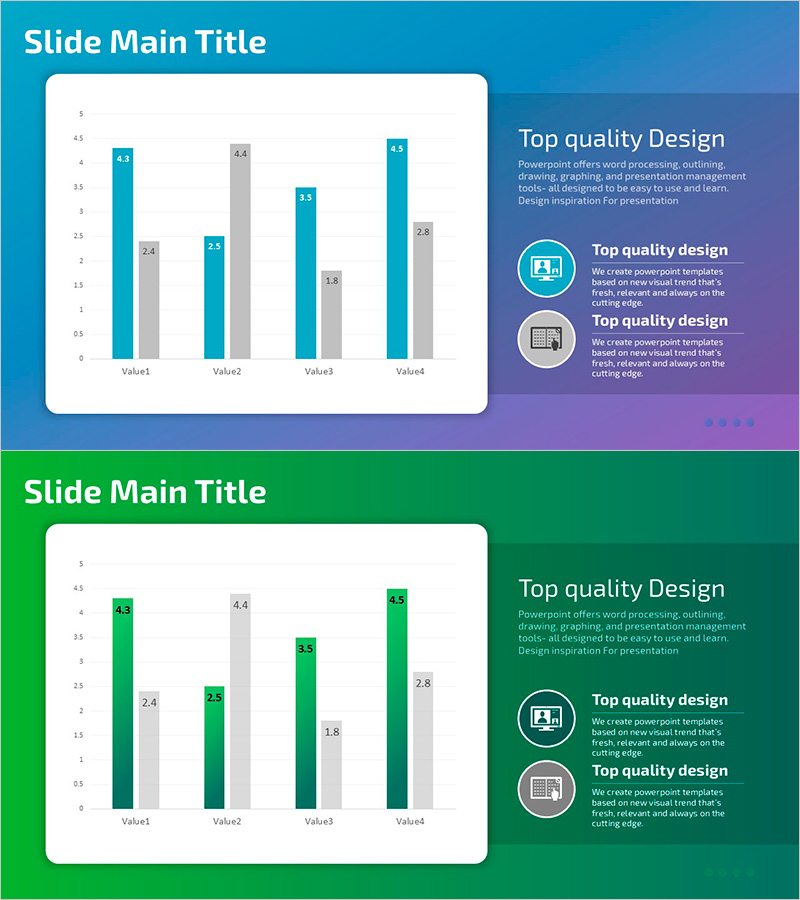
A PowerPoint slide featuring a vertical bundled bar chart comparing four data values across multiple categories. The design uses teal and gray color series to visualize market analysis, competitive benchmarking, and performance evaluation data. Each of the four items displays paired bars for clear numerical comparison, making it ideal for business reports, strategy presentations, and executive briefings. The chart structure enables immediate use in data-driven decision-making presentations.
Usage Points
-
Main Usage
Visualizes four data items using a vertical bundled bar chart format to enable clear comparative analysis. Optimized for comparing market sizes, competitive performance metrics, quarterly or annual results, and multi-dimensional business data across categories.
-
How to Use
Insert into business reports, marketing strategy presentations, investor pitch decks, and executive briefings during competitive landscape analysis sections. Bar heights enable intuitive numerical comparison while color differentiation clearly distinguishes data series.
-
Recommended For
Marketing professionals, strategy planners, executives, management consultants, and business analysts requiring data-driven presentations. Ideal for market analysis, competitive benchmarking, performance evaluation, and quarterly business reviews.
-
Slide Structure
2-slide set. Title area at top, central chart area with Value1–Value4 items each displaying teal and gray paired bars, right-side text description panel. 16:9 widescreen format optimized for projector displays and online presentations.
Related Products
-

Analyzing 2 Comparison Graphs - Slides for Deriving Competitive Advantage
#Market and Competitor Analysis #Graph #Competitor Analysis
-

Blue Orange Competitive Analysis Bar Graph
#Market and Competitor Analysis #Graph #Competitor Analysis
-

PC Mockup & Column Bundle Graph
#Market and Competitor Analysis #Graph #Other
-

Competitor Analysis by Year Bundled Graph – Market Trend Insights
#Market and Competitor Analysis #Diagram #Graph
