Blue Orange Competitive Analysis Bar Graph
RJ0300090_16
- Last Update 05/14/2025
- File Size 0.2MB
- # of Slides 2
- File Format PPTX
- Slide Ratio 16:9
- Color
Keywords
- #Content-Based Slides
- #Design-Based Slides
- #Market and Competitor Analysis
- #Graph
- #Competitor Analysis
- #Competitive Advantage
- #Column
- #Grouped Column
- #16:9
- #vertical bar chart PowerPoint
- #bar graph slide template
- #competitive analysis chart
- #comparison data visualization
- #market analysis presentation
About the Product
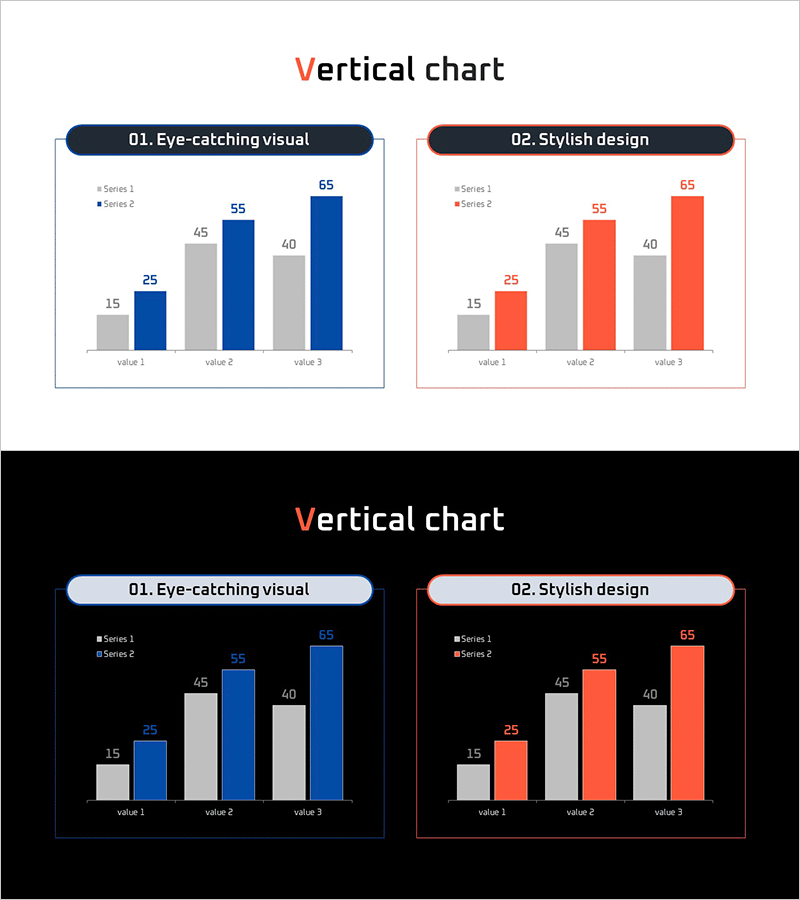
A vertical bar chart PowerPoint slide optimized for competitive analysis and market comparison presentations. This slide features two data series (blue and orange) displaying six items with values ranging from 15 to 65, enabling clear numerical comparison at a glance. The header label area emphasizes your analysis topic, while the legend identifies each series. Two design variations are included—an eye-catching visual version and a stylish design version—allowing you to choose the tone that best fits your presentation context. Delivered in 16:9 widescreen PPTX format for immediate editing and customization.
Usage Points
-
Main Usage
Ideal for presenting competitive analysis, market research results, sales volume comparisons, and performance metrics where two data series need to be compared side-by-side. The blue and orange color contrast visually distinguishes the two series, while value labels on each bar ensure precise data communication.
-
How to Use
Enter your analysis title in the header label area (e.g., Competitive Analysis, Market Share). Replace the item names (value 1–3) and numerical values (15–65) with your actual data. Update the legend text (Series 1 and Series 2) to reflect your comparison subjects. Select either the eye-catching or stylish design version based on your presentation tone.
-
Recommended For
Marketing professionals, sales strategy teams, executives preparing performance reports, management consultants conducting market analysis, and business development managers presenting competitive positioning, sales performance, customer satisfaction scores, or market penetration data.
-
Slide Structure
2-slide set. Each slide contains a header label box (numbered 01 and 02), a legend identifying Series 1 and Series 2, and a vertical bar chart with 6 items. The first slide presents an eye-catching visual version with dark background; the second offers a stylish design version with light background, both using identical data structure.
Related Products
-

Bar Chart Visualizing Freight Transport Trends – Essential Market Analysis Tool
#Market and Competitor Analysis #Graph #Text Box
-

Triangular Pattern Column Chart Template – Market Competitive Advantage Analysis
#Market and Competitor Analysis #Graph #Competitor Analysis
-

Competitiveness Table and Chart Analysis – Market and Competitor Analysis
#Market and Competitor Analysis #Diagram #Graph
-

Analyzing 2 Comparison Graphs - Slides for Deriving Competitive Advantage
#Market and Competitor Analysis #Graph #Competitor Analysis
