Graphs of Learning and Growth – Visual Data Presentation
RJ0500038_15
- Last Update 06/17/2025
- File Size 0.4MB
- # of Slides 2
- File Format PPTX
- Slide Ratio 16:9
- Color
Keywords
- #Content-Based Slides
- #Design-Based Slides
- #Market and Competitor Analysis
- #Diagram
- #Graph
- #Competitive Advantage
- #Cluster
- #Horizontal Bar
- #Closed Cluster Diagram
- #Segmented Horizontal Bar
- #16:9
- #horizontal bar chart PowerPoint
- #data comparison slide template
- #learning growth graph
- #bar chart slide design
- #numerical comparison PowerPoint
About the Product
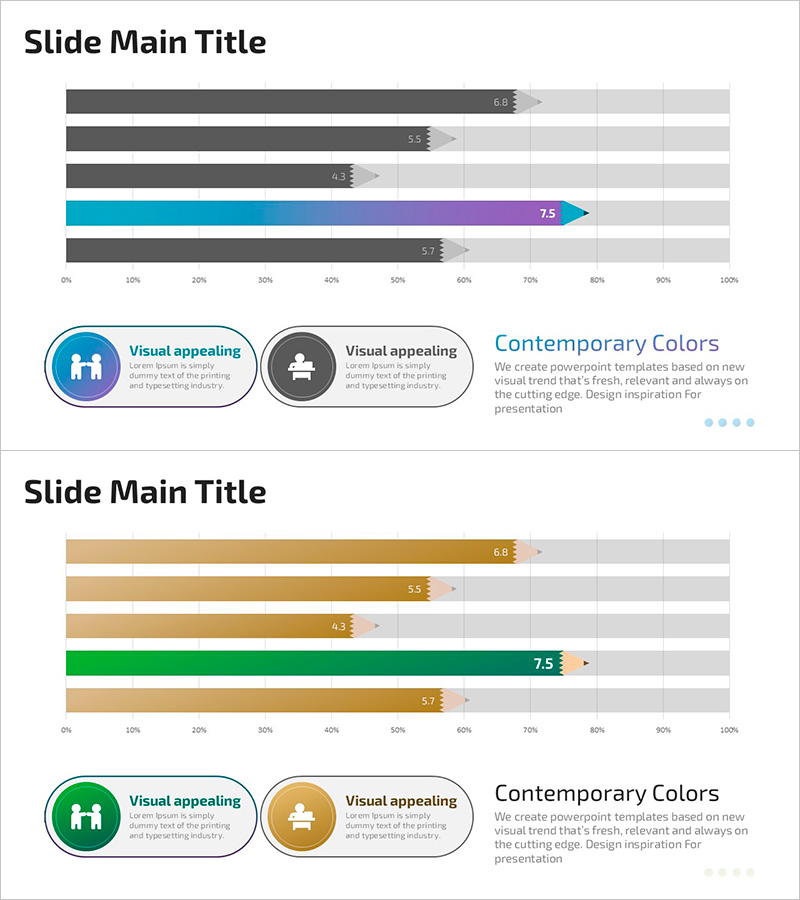
A horizontal bar chart PowerPoint slide that visually presents learning and growth trends across five comparable data points. This slide deck is ideal for market analysis, competitive benchmarking, and performance comparisons in business presentations. The design features a blue-to-purple gradient accent bar paired with gray background bars to clearly distinguish data layers. The 2-slide set is ready to edit immediately and comes in 16:9 widescreen PPTX format for seamless integration into your presentation.
Usage Points
-
Main Usage
Enables side-by-side comparison of five data points to instantly reveal relative magnitude, ranking, and performance metrics. Ideal for presenting learning progress, growth indicators, market share, competitive analysis, and other quantitative insights.
-
How to Use
Adjust bar lengths to input your actual data values and update legend labels and numerical annotations. Slide 1 displays the full comparison view, while Slide 2 offers an enlarged version for emphasizing specific data points during your presentation.
-
Recommended For
Recommended for executive reports, business plans, marketing strategies, quarterly performance reviews, educational seminars, and learning progress updates. Best suited for planners, analysts, educators, and marketing professionals who need to communicate quantitative data clearly.
-
Slide Structure
Slide 1: Five-item horizontal bar chart with blue-to-purple gradient accent bar, gray background bar, and numerical labels. Slide 2: Enlarged version of the same structure for highlighting specific items. 16:9 widescreen format, PPTX file type.
Related Products
-

Visualization Slide for Preference in Online Learning
#Market and Competitor Analysis #Marketing Plan and Strategy #Diagram
-

Comparative Analysis Detailed Bar Graph – Optimal Tool for Competitor Analysis
#Market and Competitor Analysis #Graph #Competitor Analysis
-

Performance Analysis Breakdown Bar Graph – Market and Competitor Analysis
#Company Introduction #Market and Competitor Analysis #Diagram
-

Visualization of Game Match Result Score – Emphasizing Competitive Advantage
#Market and Competitor Analysis #Diagram #Text Box
