Youth Analysis Graph - Visualizing Gender Customer Analysis Data
RJ0500036_7
- Last Update 06/17/2025
- File Size 1MB
- # of Slides 2
- File Format PPTX
- Slide Ratio 16:9
- Color
Keywords
- #Content-Based Slides
- #Design-Based Slides
- #Market and Competitor Analysis
- #Graph
- #Customer Analysis
- #Horizontal Bar
- #Grouped Horizontal Bar
- #16:9
- #grouped bar chart PowerPoint
- #horizontal bar graph slide template
- #gender comparison analysis
- #customer data visualization
- #PowerPoint chart slide design
About the Product
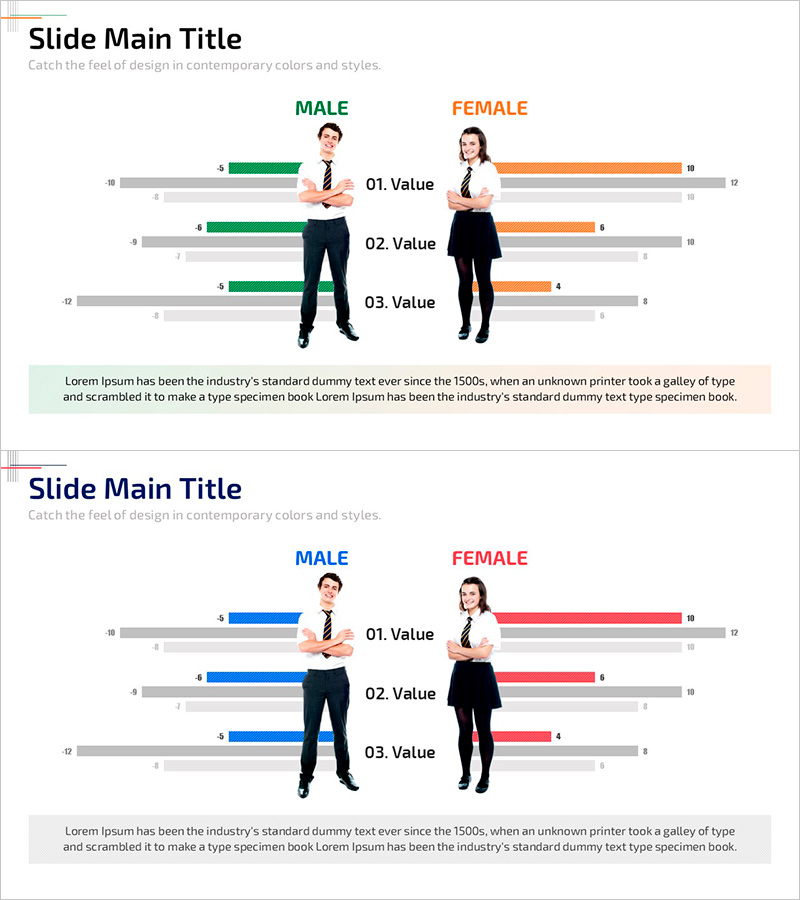
A grouped horizontal bar chart PowerPoint slide set designed to visualize gender-based customer analysis data. The slides feature male and female silhouettes with color-coded bar groups—green and blue for male, orange and pink for female—comparing three data metrics across gender segments. Ideal for youth demographic analysis, marketing segmentation, customer preference studies, and gender-based performance reports. The 2-slide set offers two color variations, allowing you to match your corporate branding while maintaining consistent data visualization structure.
Usage Points
-
Main Usage
Visualize gender-based customer preferences, purchasing patterns, satisfaction scores, or demographic insights through side-by-side bar comparisons. Effectively communicate data-driven analysis for market segmentation, customer profiling, and strategic decision-making in business presentations.
-
How to Use
Replace the placeholder values (01. Value, 02. Value, 03. Value) with your actual metric labels and update bar lengths to reflect your data. Maintain the male-female silhouette layout and color coding while customizing numbers and labels for immediate presentation use.
-
Recommended For
Marketing teams presenting customer analysis reports, sales strategy briefings, market research findings, product development teams analyzing target demographics, and executive presentations requiring gender-segmented data comparison. Suitable for any business context where gender-based data visualization is essential.
-
Slide Structure
Two-slide set, each containing a grouped horizontal bar chart with three data metrics. Left side displays male figure with green and blue bars; right side shows female figure with orange and pink bars. Gray reference bars provide baseline context, with numerical labels positioned at bar endpoints for clarity.
Related Products
-

Consumer Analysis Graph by Age – Diagram for Enhancing Customer Insights
#Market and Competitor Analysis #Customer Success Stories #Diagram
-

Graph of the Effects of Harmony on a Child – Understanding Customers
#Market and Competitor Analysis #Graph #Other
-

Medical Illustration Bar Graph for Customer Analysis Visualization
#Market and Competitor Analysis #Graph #Customer Analysis
-

Children's Depression Index Trends – Insights Through Customer Analysis
#Market and Competitor Analysis #Graph #Customer Analysis
