Medical Illustration Bar Graph for Customer Analysis Visualization
RJ0400023_8
- Last Update 05/24/2025
- File Size 4.6MB
- # of Slides 2
- File Format PPTX
- Slide Ratio 16:9
- Color
Keywords
- #Content-Based Slides
- #Design-Based Slides
- #Market and Competitor Analysis
- #Graph
- #Customer Analysis
- #Horizontal Bar
- #Grouped Horizontal Bar
- #16:9
- #medical bar chart PowerPoint
- #healthcare customer analysis slide
- #horizontal bar graph template
- #2-series data visualization
- #market analysis PowerPoint slide
- #healthcare presentation template
About the Product
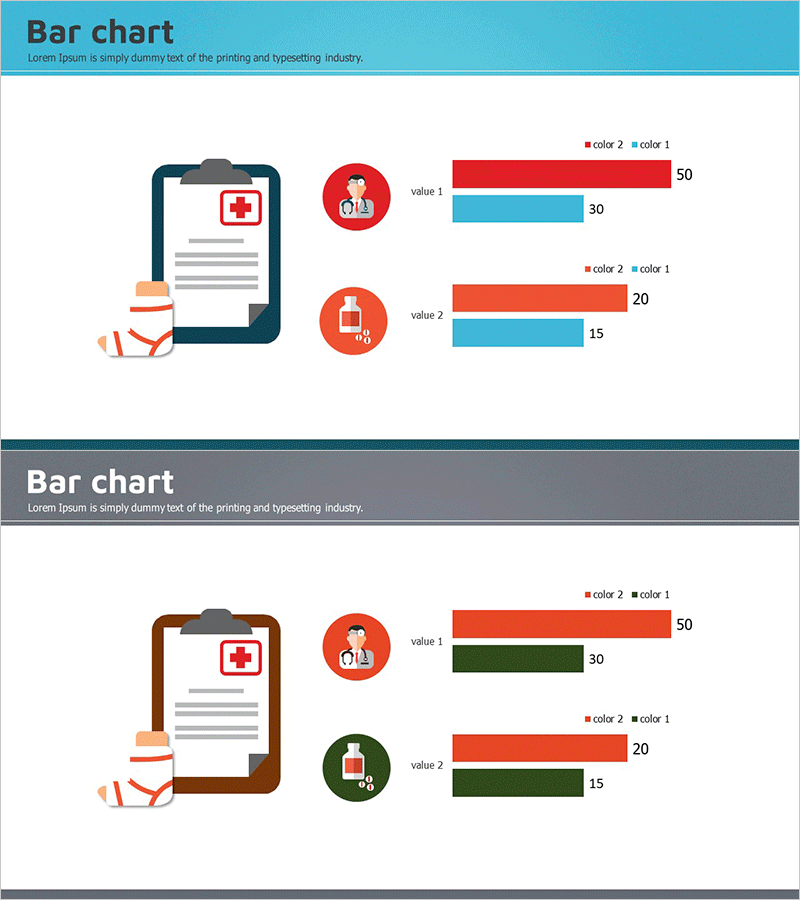
A horizontal bar chart PowerPoint slide designed for healthcare customer analysis visualization. This presentation template combines medical illustrations (clipboard and healthcare icons) with a 2-series horizontal bar graph to compare customer segments and market data intuitively. The slide uses red and blue color schemes to differentiate data series, with numeric labels clearly displayed on each bar for immediate readability. The 2-slide set includes color variations (blue-red and green-red combinations) allowing you to match your document's visual identity. Perfect for business proposals, market analysis reports, and investor presentations in the healthcare sector.
Usage Points
-
Main Usage
Visualize customer segment comparisons and market analysis data in the healthcare industry using horizontal bar charts. Medical illustrations emphasize industry relevance while 2-series data comparison provides clear decision-making insights and performance metrics.
-
How to Use
Double-click the numeric labels on the slide to edit values with your actual data. Replace item names (value 1, value 2) with customer segments, product categories, or regional names. Adjust bar lengths and numbers accordingly. Use the color variation slide to match your corporate branding guidelines.
-
Recommended For
Ideal for healthcare institutions, pharmaceutical companies, and health-tech startups presenting business plans, investor pitches, marketing strategies, and market research reports. Suitable for comparing customer satisfaction rates, market share, product revenue, and other 2-series metrics.
-
Slide Structure
Slide 1: Blue-red color scheme / Slide 2: Green-red color scheme. Each slide features medical illustrations on the left (clipboard and healthcare icons) with 2-item horizontal bar graphs on the right. Numeric labels displayed on each bar with legend indicators (color 1, color 2).
Related Products
-

Youth Analysis Graph - Visualizing Gender Customer Analysis Data
#Market and Competitor Analysis #Graph #Customer Analysis
-

Children's Depression Index Trends – Insights Through Customer Analysis
#Market and Competitor Analysis #Graph #Customer Analysis
-

Consumer Analysis Graph by Age – Diagram for Enhancing Customer Insights
#Market and Competitor Analysis #Customer Success Stories #Diagram
-

Graph of the Effects of Harmony on a Child – Understanding Customers
#Market and Competitor Analysis #Graph #Other
