Consumer Analysis Graph by Age – Diagram for Enhancing Customer Insights
RM0200012_15
- Last Update 02/04/2025
- File Size 1.9MB
- # of Slides 2
- File Format PPTX
- Slide Ratio 16:9
- Color
Keywords
- #Content-Based Slides
- #Design-Based Slides
- #Market and Competitor Analysis
- #Customer Success Stories
- #Diagram
- #Graph
- #Customer Analysis
- #Customer Testimonials and Feedback
- #Cluster
- #Horizontal Bar
- #Closed Cluster Diagram
- #Grouped Horizontal Bar
- #16:9
- #age group customer analysis chart
- #bar chart PowerPoint slide
- #consumer analysis presentation
- #market analysis diagram
- #age demographic data visualization
- #customer segmentation template
About the Product
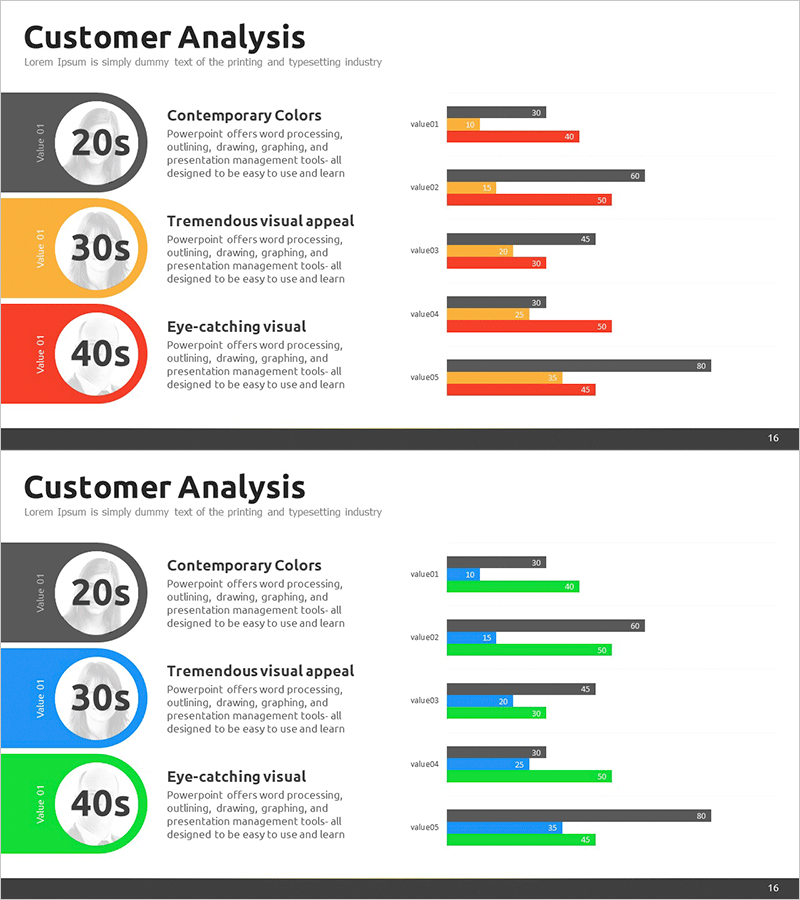
A horizontal bar chart PowerPoint slide that visualizes consumer analysis data by age group. This presentation template combines circular diagrams for 20s, 30s, and 40s customer segments with comparative bar graphs showing five evaluation metrics across age demographics. The design uses orange, gray, and red color schemes to distinguish each age group, with integrated text descriptions and numerical comparisons for market analysis presentations. The 2-slide set offers multiple color combinations in 16:9 widescreen PPTX format, ready for immediate editing and customization.
Usage Points
-
Main Usage
This bar chart slide enables side-by-side comparison of customer data segmented by age group. Circular diagrams highlight each age segment's profile, while horizontal bar graphs display numerical comparisons across five evaluation categories (color appeal, visual impact, usability, learnability, functionality) for marketing strategy and customer insight presentations.
-
How to Use
Slide 1 introduces age-based customer profiles (20s, 30s, 40s) using circular diagrams with descriptive text. Slide 2 presents five evaluation metrics as horizontal bar graphs comparing all three age groups. Replace placeholder data with your actual consumer research findings, adjust bar lengths and colors to reflect your analysis results, and customize text fields with specific customer insights.
-
Recommended For
Ideal for marketing managers, market analysts, sales strategy teams, and executive presentations. Use for consumer segmentation analysis, customer profiling, age-based preference surveys, market opportunity identification, and data-driven business decision-making presentations.
-
Slide Structure
Slide 1: Three circular diagrams representing customer profiles for 20s, 30s, and 40s age groups with demographic text labels. Slide 2: Five horizontal bar graph sets comparing three age groups across evaluation metrics (color, visual appeal, usability, learnability, functionality), color-coded in orange, gray, and red for age group distinction.
Related Products
-

User Interviews & Personas Slide – Essential Tool for Customer Analysis
#Market and Competitor Analysis #Customer Success Stories #Diagram
-

Expert Profiles Overview at a Glance
#Market and Competitor Analysis #Customer Success Stories #Diagram
-

Participant Feedback Review Slide – Capturing Customer Voices
#Market and Competitor Analysis #Customer Success Stories #Diagram
-

Customer Analysis Slide Visualizing Trial Results
#Market and Competitor Analysis #Customer Success Stories #Diagram
