Bundled Vertical Graph 5 Sets – Market and Competition Analysis
RJ0500036_16
- Last Update 06/16/2025
- File Size 0.5MB
- # of Slides 2
- File Format PPTX
- Slide Ratio 16:9
- Color
Keywords
About the Product
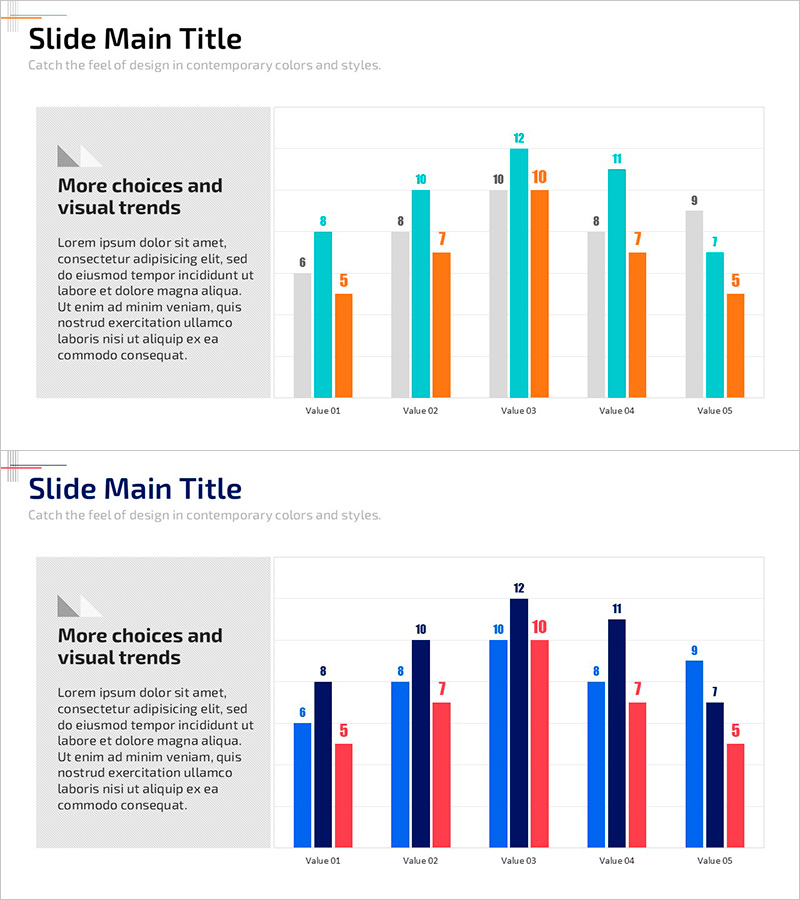
A bundled vertical bar chart PowerPoint slide optimized for market analysis and competitive positioning. This presentation template displays three data series across five items side-by-side, enabling direct comparison on the same scale. Color-coded bars in teal, blue, and orange clearly distinguish each series, with numeric labels above each bar for precise data reading. The left text area accommodates key messages and insights, making this slide template immediately applicable to business reports, competitive analysis decks, and strategic presentations.
Usage Points
-
Main Usage
Compares multiple data points across several categories simultaneously—such as market size, market share, or competitor performance. The bundled layout makes within-category series differences immediately apparent, serving as core evidence in business strategy, marketing planning, and investor pitch decks.
-
How to Use
Adjust bar heights to match your actual data values and update numeric labels accordingly. Colors can be customized to align with corporate branding or presentation theme. Add analysis conclusions or key insights in the left text box to contextualize the data visualization.
-
Recommended For
Recommended for executives, business planners, marketing professionals, consultants, and analysts presenting quantitative comparisons. Ideal for quarterly performance reviews, competitive benchmarking, market research findings, and investment pitch materials.
-
Slide Structure
Two-slide template. Each slide divides into a left text area (title and description) and right chart area. The chart comprises five items (Value 01–05) with three bundled vertical bars per item (teal, blue, orange), with numeric labels positioned above each bar for accurate data representation.
Related Products
-

Study Topic Vertical Bar Graph – Marketing Strategy Analysis
#Market and Competitor Analysis #Marketing Plan and Strategy #Graph
-

Simple Circle Template Column Chart – Market Analysis and Strategy
#Market and Competitor Analysis #Graph #Competitive Advantage
-

Analyzing 2 Comparison Graphs - Slides for Deriving Competitive Advantage
#Market and Competitor Analysis #Graph #Competitor Analysis
-

Bundled Graphs and Maps for Business Plan Visualization
#Market and Competitor Analysis #Graph #Other
