Donut Chart Slide Visualizing Marriage Survey Data
RJ0800009_16
- Last Update 08/02/2025
- File Size 0.6MB
- # of Slides 2
- File Format PPTX
- Slide Ratio 16:9
- Color
Keywords
About the Product
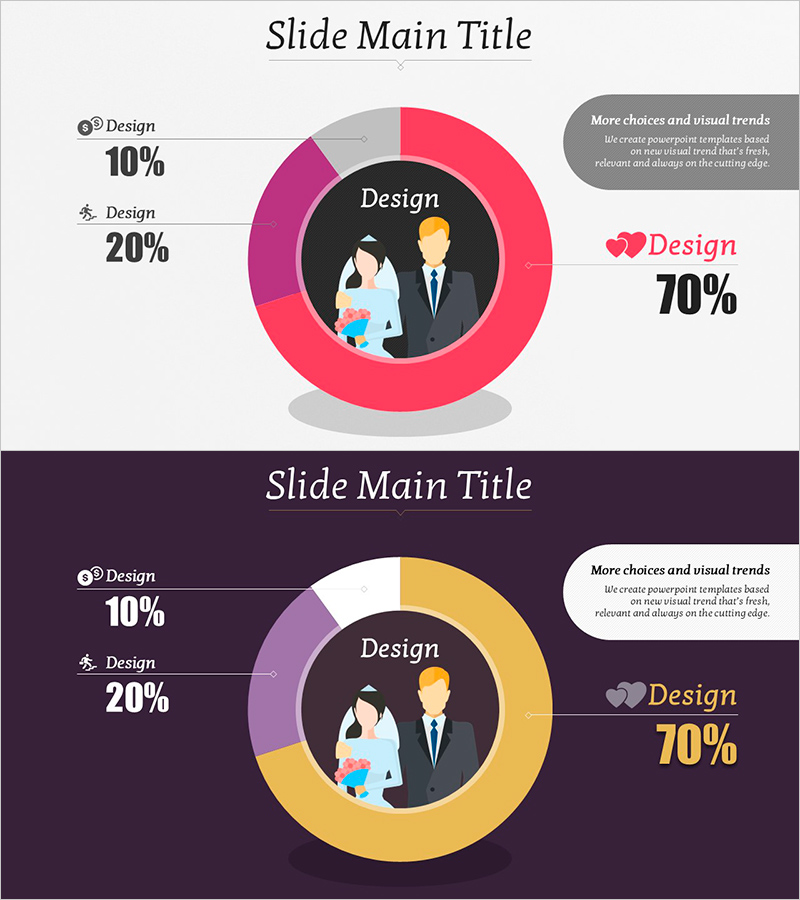
A donut chart PowerPoint slide designed to visualize marriage-related survey data with three distinct segments. The slide features a central business illustration surrounded by a three-part donut chart, making it ideal for customer analysis, market share representation, and preference surveys. Two versions are included: a light gray background and a dark purple background, with clear color differentiation in pink, purple, and yellow for easy segment identification. The 16:9 widescreen PPTX format allows immediate editing and seamless integration into presentations, reports, and business proposals.
Usage Points
-
Main Usage
Clearly visualizes survey and statistical data relationships using a three-segment donut chart format. The central illustration reinforces the topic while the chart provides intuitive data communication, perfect for customer analysis, market research, and preference analysis presentations.
-
How to Use
Insert this slide into the data analysis section of your presentation to explain survey results. Input your numerical values and the proportions automatically adjust; customize colors and labels to match your organization's branding. Suitable for reports, business proposals, and marketing presentations.
-
Recommended For
Marketing teams presenting market research findings, HR departments sharing employee satisfaction surveys, planning teams reporting customer preference analysis, and sales teams presenting customer segmentation data. Recommended for any professional role requiring data-driven decision-making presentations.
-
Slide Structure
Two-slide set: light gray background version and dark purple background version. Each slide features a central business illustration (couple), left-side numerical data display for three items, and a right-side donut chart. The chart is divided into three segments in pink, purple, and yellow for clear visual distinction.
Related Products
-

Important Things in Sea Travel – Customer Analysis Data Visualization
#Market and Competitor Analysis #Graph #Customer Analysis
-

Children's Competency Analysis Chart – Competitive Market Analysis
#Market and Competitor Analysis #Graph #Customer Analysis
-

Spotlight on Customer Segments – Market Share Network
#Market and Competitor Analysis #Graph #Customer Analysis
-

Market Share Donut Pie Chart & Silhouette – Unique Design and Information Delivery
#Market and Competitor Analysis #Graph #Other
