Children's Competency Analysis Graph – Visualization for Creativity and Growth
RJ0500035_20
- Last Update 06/16/2025
- File Size 0.5MB
- # of Slides 2
- File Format PPTX
- Slide Ratio 16:9
- Color
Keywords
About the Product
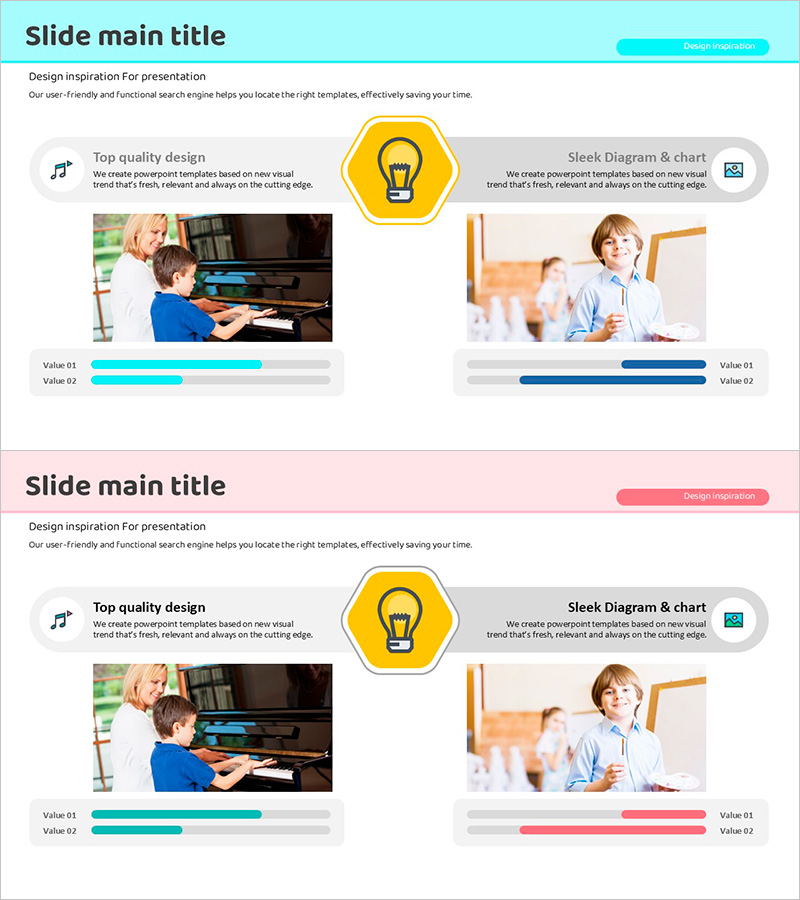
A PowerPoint slide designed to visually analyze children's creativity, growth, and competency levels. The template features two color themes—cyan and pink—with each slide containing two image areas and two horizontal bar graph sections. Ideal for educational institutions, child development centers, and parent consultation materials, this slide effectively communicates assessment results. Available in 16:9 PPTX format with fully editable elements; simply input data values and the graphs update automatically.
Usage Points
-
Main Usage
This slide quantitatively analyzes and visualizes children's creativity, growth rate, and competency levels. It communicates assessment results intuitively to parents, teachers, and stakeholders while clearly distinguishing individual strengths and areas for improvement.
-
How to Use
Use in end-of-semester evaluation reports, parent consultation materials at child development centers, and psychological assessment presentations. Select the cyan theme for boys or the pink theme for girls, or match your institution's branding preferences.
-
Recommended For
Kindergarten and elementary school teachers, child psychology specialists, educational center directors, and educators conducting parent consultations will find this template most effective for sharing individual assessment results and developmental progress.
-
Slide Structure
Two-slide layout with each slide featuring a title area at the top, two image areas (left and right for photo insertion), and two horizontal bar graphs at the bottom (Value 01 and Value 02). Text and numerical input fields are clearly separated for easy customization.
Related Products
-

Learning Content Customer Analysis Slide - Intuitive Graphs and Data Visualization
#Market and Competitor Analysis #Marketing Plan and Strategy #Graph
-

User Analysis Pictogram Graph – Visualizing Customer Success
#Market and Competitor Analysis #Customer Success Stories #Graph
-

Customer Analysis Area Chart – Data Visualization for Market Understanding
#Market and Competitor Analysis #Graph #Other
-

Data Visualization Slide Template Featuring World Map
#Market and Competitor Analysis #Graph #Other
