Map Graph on the Background of the Full Moon – Market and Competitor Analysis
RJ0500033_27
- Last Update 06/16/2025
- File Size 1.7MB
- # of Slides 2
- File Format PPTX
- Slide Ratio 16:9
- Color
Keywords
- #Content-Based Slides
- #Design-Based Slides
- #Market and Competitor Analysis
- #Graph
- #Other
- #Market Analysis
- #Column
- #Grouped Column
- #Map
- #16:9
- #world map PowerPoint slide
- #map bar chart template
- #global data comparison slide
- #regional market analysis PPT
- #world map graph template
- #international comparison slide
About the Product
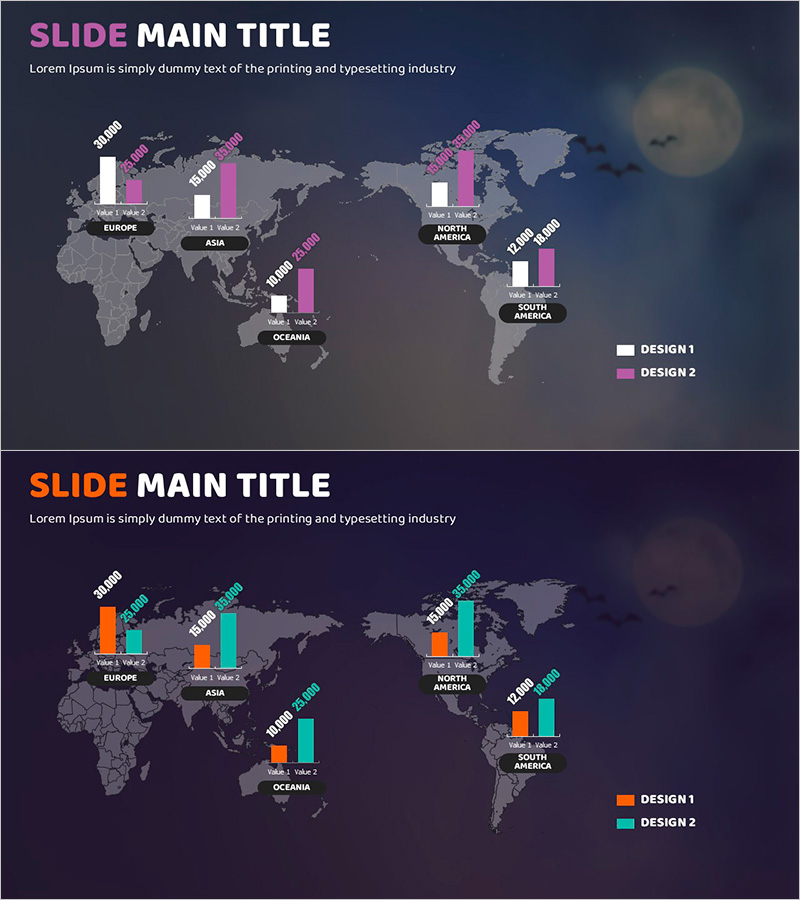
A PowerPoint slide featuring a world map with a full moon background, displaying bar charts for 6 global regions (Europe, Asia, North America, South America, Oceania). Each region shows 2-series data represented in white and magenta bars, perfect for visualizing market size, competitor market share, and sales comparisons. The 2-slide set includes a magenta-accent version and an orange-cyan version, adapting to various presentation contexts. Directly editable labels and values enable immediate use in global business presentations and data analysis reports.
Usage Points
-
Main Usage
Visualize global market size, regional sales figures, competitor market share, and international business performance across 6 world regions at a glance. The full moon background creates a distinctive, memorable impression for international business strategy, global expansion, and cross-border market entry presentations.
-
How to Use
Double-click bar chart values to edit directly or link Excel data. Modify legend labels (DESIGN 1·2) to reflect comparison metrics. Add or highlight specific regions, and alternate between the two color versions to distinguish presentation sections or time-period comparisons.
-
Recommended For
Executives, strategy teams, marketing departments, and sales teams presenting international business updates, quarterly performance reports, new market entry proposals, and competitive analysis. Ideal for consulting firms, trading companies, multinational corporations' investor presentations, and overseas branch reporting.
-
Slide Structure
2-slide set. Each slide contains a grayscale world map background + 6 regional location markers + 2-series bar charts per region (height-based comparison) + legend + title and subtitle areas. Slide 1 uses white-magenta color scheme; Slide 2 uses orange-cyan scheme for visual variation.
Related Products
-

Leather Material Presentation Template Column Chart
#Market and Competitor Analysis #Graph #Other
-

Asian Target Market Analysis Graph
#Market and Competitor Analysis #Graph #Other
-

Global Area Analysis Bar Graph – Visualization of Market and Competition
#Company Introduction #Market and Competitor Analysis #Graph
-

Bundled Graphs and Maps for Business Plan Visualization
#Market and Competitor Analysis #Graph #Other
