Leather Material Presentation Template Column Chart
RJ0200021_8
- Last Update 04/03/2025
- File Size 6.3MB
- # of Slides 2
- File Format PPTX
- Slide Ratio 16:9
- Color
Keywords
- #Content-Based Slides
- #Design-Based Slides
- #Market and Competitor Analysis
- #Graph
- #Other
- #Market Share
- #Market Analysis
- #Column
- #Grouped Column
- #Map
- #16:9
- #world map PowerPoint slide
- #map chart template
- #column chart slide
- #regional data analysis
- #market analysis presentation
- #geographic data visualization
About the Product
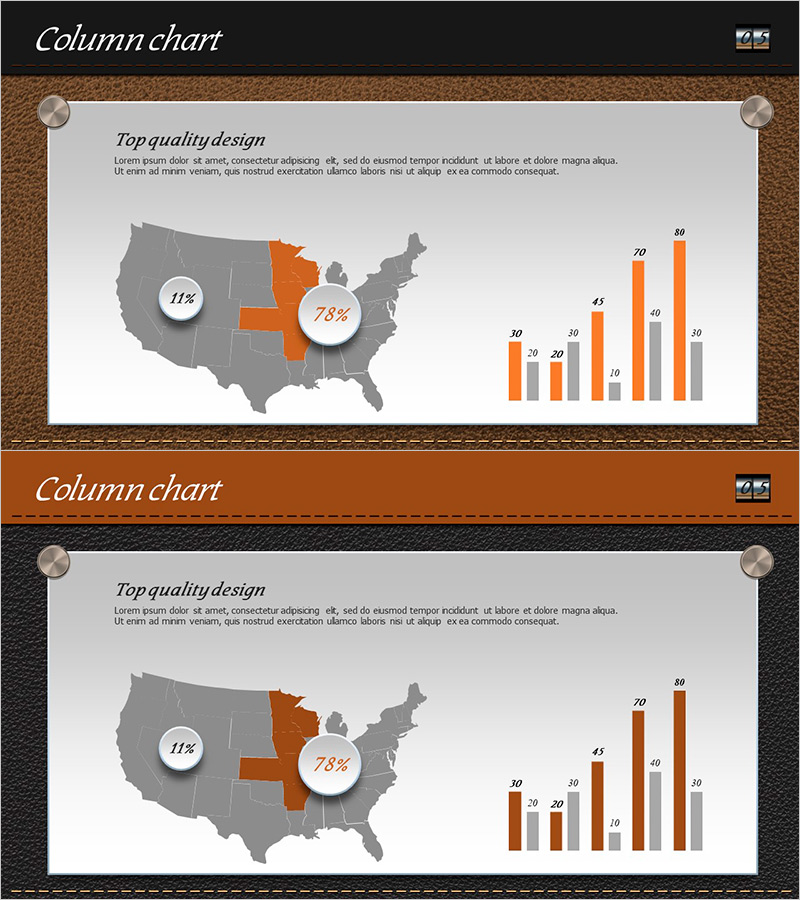
A professional PowerPoint slide combining a world map with column chart visualization on a leather-textured background. The left side displays a US map segmented in gray and orange, with circular indicators showing regional percentages (11% and 78%), while the right side features a vertical bar chart comparing 10 data points. This 2-slide set provides identical layouts ready for immediate use in market analysis, competitive benchmarking, and regional performance reporting. Fully editable in 16:9 PPTX format with all elements customizable for your specific data.
Usage Points
-
Main Usage
Visualize and compare regional or geographic data across multiple dimensions simultaneously. The map highlights specific territories while the adjacent column chart displays corresponding numerical metrics, enabling audiences to understand both geographic context and quantitative performance at a glance. Ideal for presenting market size, sales volume, customer distribution, and regional performance metrics.
-
How to Use
Customize the map by changing highlighted regions from gray to orange to match your target areas. Update the circular percentage indicators with your actual regional data. Modify the column chart values and labels to reflect your dataset. The leather background and neutral color palette enhance credibility for executive presentations, investor meetings, and strategic planning sessions.
-
Recommended For
Marketing managers, sales directors, business analysts, management consultants, and investor relations professionals presenting geographic or regional performance data. Suitable for global expansion strategies, international market entry presentations, regional sales performance reviews, customer distribution analysis, and any data-driven presentation requiring geographic context.
-
Slide Structure
2 identical slides with consistent layout. Each slide contains: left section with US map (gray base + orange highlighted regions) and 2 circular percentage indicators (11%, 78%); right section with vertical column chart displaying 10 data categories (range 10–80). Includes title area 'Column chart' and descriptive text 'Top quality design'.
Related Products
-

World Map and Share Chart for Market Analysis – Effective Data Visualization
#Market and Competitor Analysis #Graph #Other
-

Map Graph on the Background of the Full Moon – Market and Competitor Analysis
#Market and Competitor Analysis #Graph #Other
-

Market Analysis with World Map and Percentage Data
#Market and Competitor Analysis #Other #Market Share
-

Map Silhouette Slide for Market Share Analysis
#Market and Competitor Analysis #Graph #Other
