SWOT Split Dot Diagram for Market Analysis
RM0200014_14
- Last Update 02/05/2025
- File Size 0.3MB
- # of Slides 2
- File Format PPTX
- Slide Ratio 16:9
- Color
Keywords
- #Content-Based Slides
- #Design-Based Slides
- #Market and Competitor Analysis
- #Diagram
- #SWOT Analysis
- #Market Analysis
- #Cluster
- #Closed Cluster Diagram
- #16:9
- #SWOT analysis diagram
- #SWOT PowerPoint slide
- #4-quadrant diagram template
- #SWOT analysis template PowerPoint
- #market analysis diagram
- #competitive analysis slide
About the Product
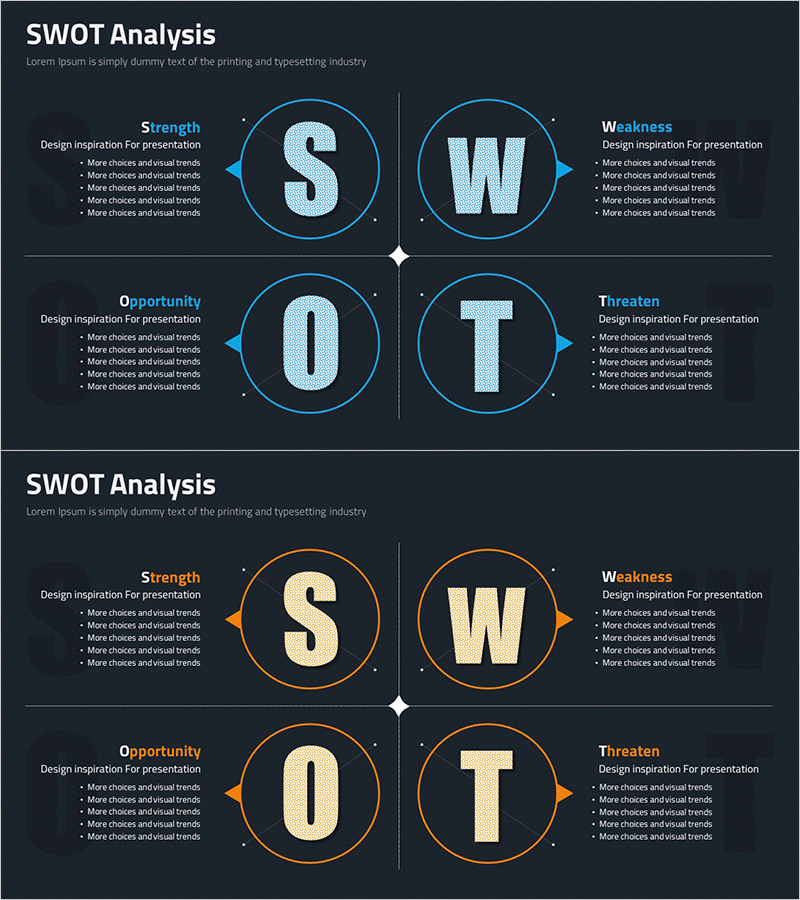
A PowerPoint slide featuring SWOT analysis divided into four circular nodes representing Strengths, Weaknesses, Opportunities, and Threats. The symmetrical layout with a central cross axis creates an intuitive visual representation of each element's relationship. Two color versions—blue and orange—are included, with each circular node containing a title and five text input areas for detailed analysis. Ready to use for market analysis, competitive analysis, and strategic planning presentations.
Usage Points
-
Main Usage
Systematically analyze a company's strengths, weaknesses, opportunities, and threats while developing market strategy. The symmetrical four-node layout visually represents the balance of each element, supporting decision-making for executives, marketing teams, and strategy professionals.
-
How to Use
Enter analysis content into the text input areas of each circular node (Strengths, Weaknesses, Opportunities, Threats). Select either the blue or orange color version to match your corporate branding, and add arrows or connecting lines to emphasize relationships between elements.
-
Recommended For
Ideal for executives, business development teams, marketing professionals, consultants, and educators presenting strategic meetings, business plans, and management analysis reports. Essential for new business ventures, product launches, and market entry strategy development.
-
Slide Structure
2-slide set. Slide 1: Blue SWOT diagram with central cross axis, four circular nodes, and five text input areas per node. Slide 2: Orange version with identical structure. 16:9 widescreen format, PPTX file.
Related Products
-

Square Diagram for SWOT Analysis – Effective Market and Competitor Analysis
#Market and Competitor Analysis #Diagram #SWOT Analysis
-

SWOT Analysis Closed Diagram – Market and Competitor Analysis Template
#Market and Competitor Analysis #Diagram #SWOT Analysis
-

SWOT Analysis Parallelogram Diagram – Targeting Competitive Edge
#Market and Competitor Analysis #Diagram #SWOT Analysis
-

SWOT Analysis Square Diagram – Essence of Market Analysis
#Market and Competitor Analysis #Diagram #SWOT Analysis
