Halloween Hats and Pumpkin Charts – Ideal for Market Analysis
RJ0500033_16
- Last Update 06/16/2025
- File Size 1.3MB
- # of Slides 2
- File Format PPTX
- Slide Ratio 16:9
- Color
Keywords
About the Product
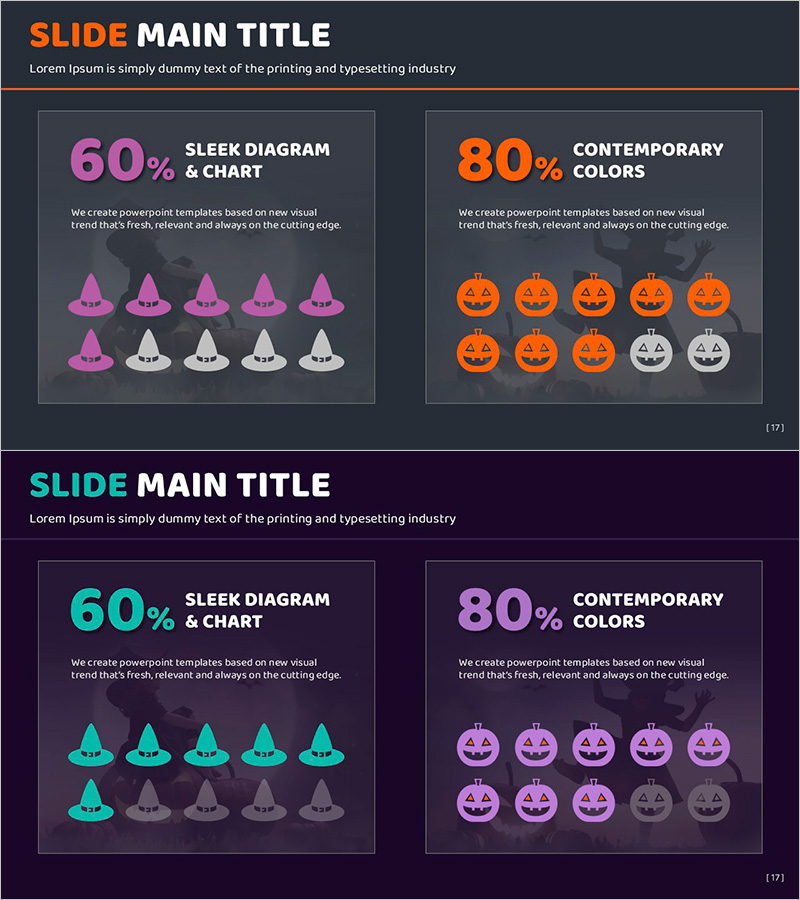
A 2-slide PowerPoint presentation optimized for market analysis presentations. This slide deck uses Halloween hat and pumpkin icons to visualize comparative data in an engaging way. The dark background with orange, purple, and gray tones creates strong contrast with bright icons, ensuring excellent readability. The left slide displays a 60% ratio to represent market share, while the right slide shows an 80% ratio for competitor comparison. The PowerPoint slides feature clearly separated text and chart areas, making them immediately editable. Perfect for presentations, reports, and analytical materials.
Usage Points
-
Main Usage
Visualize market conditions, competitor comparisons, and market share data with quantitative precision. The Halloween-themed icons soften data presentation while maintaining clarity in comparative information, making complex market analysis more accessible to audiences.
-
How to Use
Edit the text areas on left and right slides to add analysis labels and update percentage values. Adjust the number of icons and colors to match your actual data ratios. Insert into market analysis sections, competitive analysis pages, or business status reports.
-
Recommended For
Marketing managers, business planning teams, investor relations professionals, and market research report authors. Ideal for new market entry evaluations, market penetration strategy presentations, and competitive landscape analyses that require data credibility.
-
Slide Structure
Two-slide layout with each slide containing one title area, one text description area, and one comparison chart area. Left slide shows 60% ratio representation; right slide shows 80% ratio, allowing simultaneous presentation of two data scenarios.
Related Products
-

Map Silhouette Slide for Market Share Analysis
#Market and Competitor Analysis #Graph #Other
-

Market and Share Analysis Slide - Blue Green Design
#Market and Competitor Analysis #Graph #Other
-

Market Share Visualization of Three Countries – Effective Data Analysis
#Market and Competitor Analysis #Graph #Other
-

Camping Market Trend Survey Line Graph – Trend Displayed in Orange and Yellow
#Market and Competitor Analysis #Graph #Other
