Camping Market Trend Survey Line Graph – Trend Displayed in Orange and Yellow
RJ0600014_7
- Last Update 06/24/2025
- File Size 0.6MB
- # of Slides 2
- File Format PPTX
- Slide Ratio 16:9
- Color
Keywords
About the Product
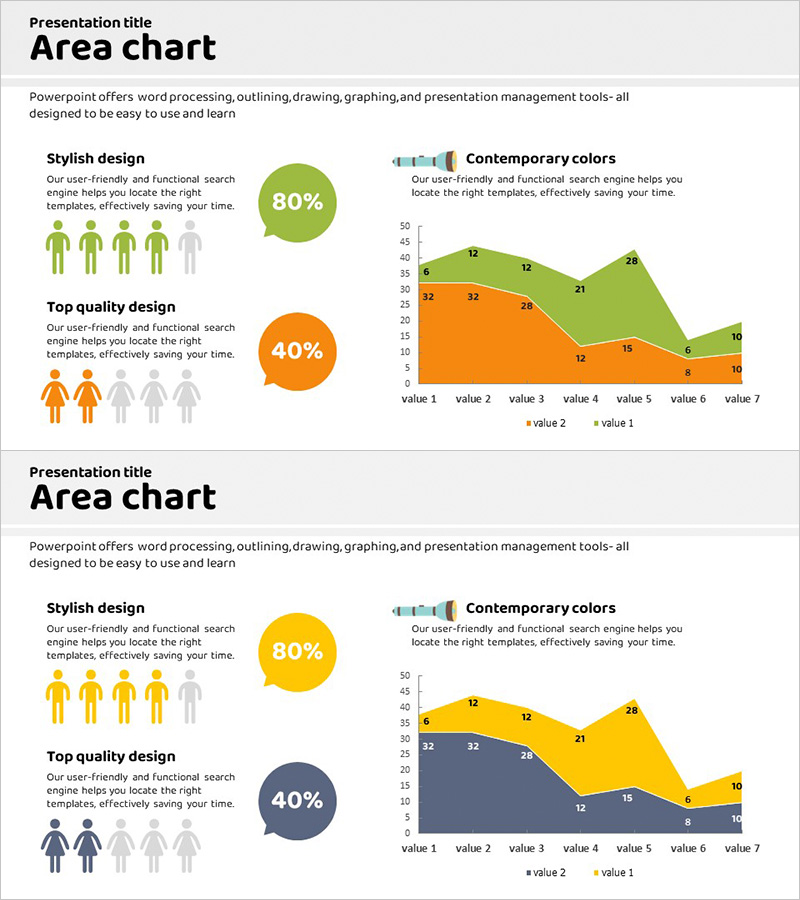
An area chart PowerPoint slide optimized for market analysis and trend comparison. This presentation slide visualizes multi-layer data using green and orange color separation, allowing you to grasp changes across seven data points at a glance. The left side features a stylish design description and quality emphasis section, while the right side displays a large-scale area chart ideal for conveying quantitative market data. Provided in 16:9 widescreen PPTX format with clearly separated text and chart areas, making it immediately ready for presentation use. Perfect for market overview, competitive analysis, market share trends, and data-driven decision support.
Usage Points
-
Main Usage
This slide visualizes quantitative data such as market overview, competitive analysis, market share trends, and change patterns using a two-layer area chart. The stacked area structure simultaneously expresses total market size and individual item changes, making it highly effective for presenting decision-making evidence.
-
How to Use
Enter your analysis topic and key insights in the left text area, then replace the chart legend, axis labels, and values with actual data. The green and orange colors can be maintained or changed to match your corporate brand colors. The seven data points can be adjusted to match your time units such as quarters, months, or years.
-
Recommended For
Recommended for marketing plans, business proposals, investor pitch decks, and market analysis reports where you need to explain market size, competitive landscape, and share changes. Particularly suitable for strategy development, executive reporting, and external presentations requiring multi-layer data comparison.
-
Slide Structure
Two-slide set. The first slide features a green-toned area chart, and the second slide provides an orange and gray-toned area chart with the same layout but different color variations. Each slide consists of three left-side text input sections (title, description, icons) and a large right-side chart area.
Related Products
-

Purple Brown Market Share Analysis – Emphasizing Visual Appeal
#Market and Competitor Analysis #Graph #Other
-

Doughnut Chart Slide Visualizing Market Share by Country
#Market and Competitor Analysis #Graph #Other
-

Mokup and Turnout Analysis Chart – Analyze with Visual Data
#Market and Competitor Analysis #Graph #Other
-

Donut Chart & Map Template for Social Network Visualization
#Market and Competitor Analysis #Graph #Other
