Data Analysis with Zombie Hand Graph Visualization
RJ0500033_12
- Last Update 06/16/2025
- File Size 0.5MB
- # of Slides 2
- File Format PPTX
- Slide Ratio 16:9
- Color
Keywords
- #Content-Based Slides
- #Design-Based Slides
- #Market and Competitor Analysis
- #Graph
- #Competitor Analysis
- #Competitive Advantage
- #Column
- #Column Chart
- #16:9
- #zombie hand bar chart PowerPoint
- #vertical bar graph slide template
- #data visualization PowerPoint
- #market analysis slide
- #competitive analysis chart
- #how to create bar chart in PowerPoint
About the Product
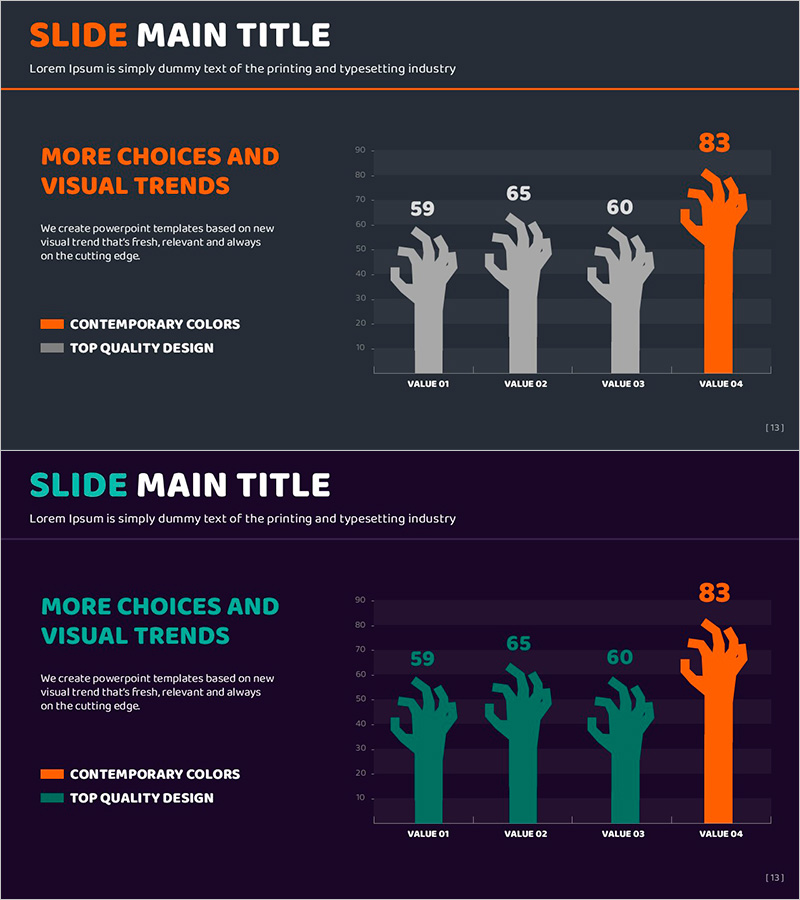
A creative vertical bar chart PowerPoint slide featuring zombie hand silhouettes for market analysis and competitive comparison. Set against a dark background with orange and gray tones, the hand-shaped bars visualize four data points (VALUE 01–04) with numerical values. The 2-slide deck offers multiple color variations (dark gray, cyan, and green accents) perfect for competitive positioning analysis, market share comparison, and sales performance metrics. Fully editable in 16:9 widescreen PPTX format for immediate customization.
Usage Points
-
Main Usage
This graph slide emphasizes quantitative data comparison through distinctive visual design. The zombie hand silhouettes capture audience attention while clearly displaying numerical differences across four categories. Ideal for market size, sales volume, market share, and performance metrics that require comparative analysis.
-
How to Use
Simply replace VALUE 01–04 labels and numbers (59, 65, 60, 83) with your own data points. Update the legend items (CONTEMPORARY COLORS, TOP QUALITY DESIGN) to match your analysis categories. The high-contrast dark background ensures excellent readability in projector presentations.
-
Recommended For
Marketing managers, sales analysts, business executives, management consultants, and data analysts preparing competitive analysis, market reports, and performance presentations. Particularly suited for startups, advertising agencies, and strategy consulting firms seeking memorable and creative presentations.
-
Slide Structure
Two-slide layout with dark gray background (orange and gray tones) on slide 1 and deep purple background (orange, cyan, and green accents) on slide 2. Each slide features a two-column layout with title and description on the left, and the bar chart on the right. The chart consists of four vertical bars with a two-item legend.
Related Products
-

Camera Comparison Competitive Analysis Slide - Data-Driven Strategy
#Market and Competitor Analysis #Graph #Competitor Analysis
-

Comparative Analysis 3D Cylinder Bar Graph – Market and Competitor Analysis
#Market and Competitor Analysis #Graph #Competitor Analysis
-

Ice Hockey Performance Graph – Competitiveness and Advantage
#Market and Competitor Analysis #Graph #Competitor Analysis
-

Color Highlight Vertical Bar Graph – Market Competition Analysis
#Market and Competitor Analysis #Graph #Competitor Analysis
