Color Highlight Vertical Bar Graph – Market Competition Analysis
RJ0900017_15
- Last Update 08/20/2025
- File Size 0.5MB
- # of Slides 2
- File Format PPTX
- Slide Ratio 16:9
- Color
Keywords
About the Product
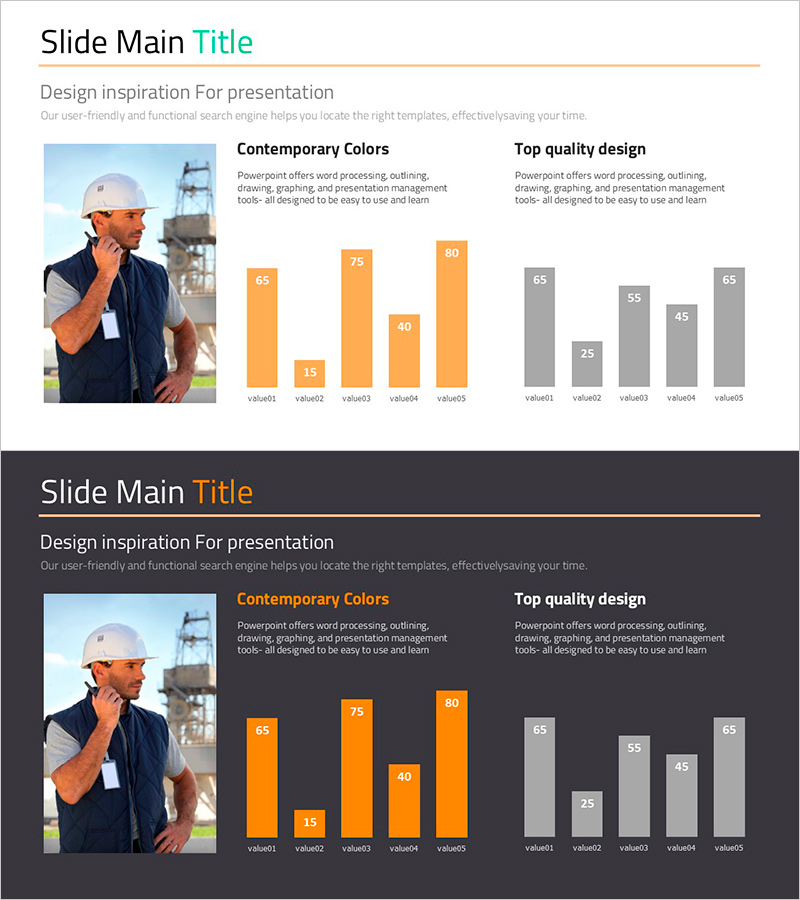
A vertical bar chart PowerPoint slide optimized for market competition analysis and data comparison. The design features a dual-tone color scheme of orange and gray, clearly representing five data items with numerical labels displayed above each bar for immediate presentation use. The 16:9 widescreen format includes two slides suitable for competitive landscape analysis, market share comparison, sales performance benchmarking, and various business presentations. The height and color differentiation of bars intuitively convey data hierarchy and comparative insights. All values and category labels are fully editable to match your presentation content.
Usage Points
-
Main Usage
Visualize quantitative data such as competitive landscape analysis, market share comparison, and sales performance through vertical bar charts. The orange accent color highlights key items while gray represents comparison targets, creating clear information hierarchy for audience comprehension.
-
How to Use
Use in business strategy presentations, market analysis reports, executive briefings, and investor pitch decks to compare competitive metrics numerically. Bar height represents data magnitude while color contrast distinguishes categories, enhancing audience understanding and retention.
-
Recommended For
Marketing managers, strategic planning teams, sales directors, and executives presenting competitive analysis results, market trends, and sales achievements. Ideal for business presentations requiring quantitative data comparison and competitive benchmarking.
-
Slide Structure
Two-slide layout featuring a vertical bar chart with five items. First slide displays orange-highlighted bars; second slide shows gray-toned bars. Numerical labels appear above each bar with category names (value01–value05) positioned at the bottom of each chart.
Related Products
-

Comparative Analysis 3D Cylinder Bar Graph – Market and Competitor Analysis
#Market and Competitor Analysis #Graph #Competitor Analysis
-

Layout Design Presentation Template – Column Chart
#Market and Competitor Analysis #Graph #Competitor Analysis
-

Ice Hockey Performance Graph – Competitiveness and Advantage
#Market and Competitor Analysis #Graph #Competitor Analysis
-

Camera Comparison Competitive Analysis Slide - Data-Driven Strategy
#Market and Competitor Analysis #Graph #Competitor Analysis
