Ice Hockey Performance Graph – Competitiveness and Advantage
RJ0600045_7
- Last Update 07/03/2025
- File Size 0.4MB
- # of Slides 2
- File Format PPTX
- Slide Ratio 16:9
- Color
Keywords
About the Product
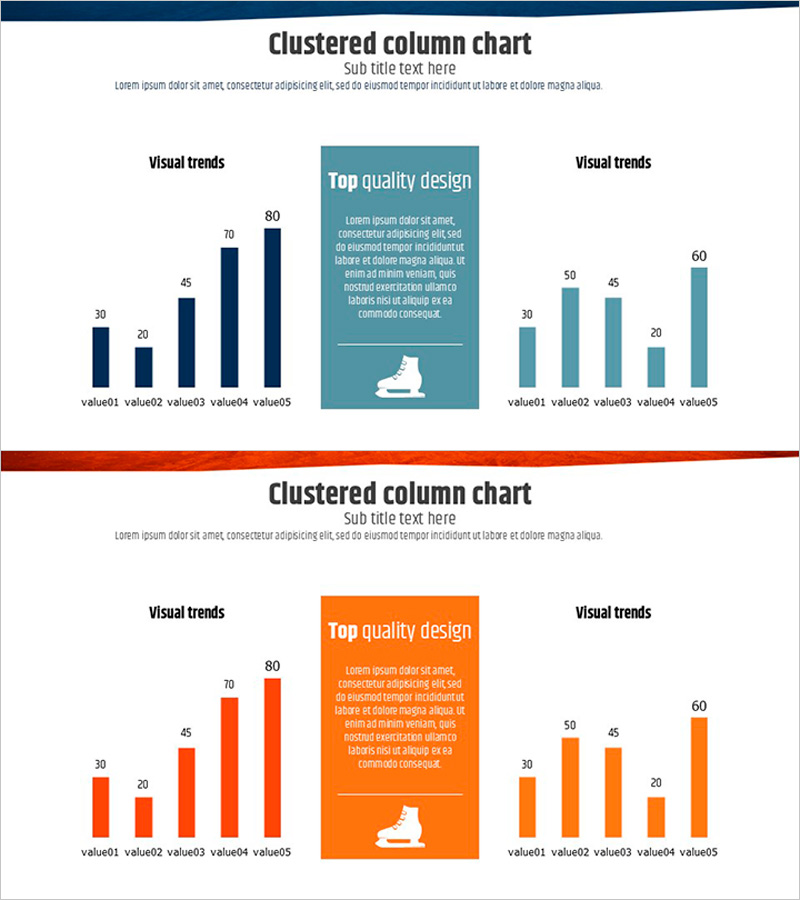
A 2-slide PowerPoint presentation featuring clustered column charts for side-by-side data comparison. The left slide uses dark navy bars while the right slide employs teal-blue bars, enabling visual contrast of two data series across five items (value01 through value05). Ideal for competitive performance analysis, market advantage assessment, quarterly results comparison, and benchmarking presentations. The central 'Top quality design' text box serves as a key message highlight area. Formatted in 16:9 widescreen ratio for modern presentation environments with fully editable PPTX elements.
Usage Points
-
Main Usage
Displays two data series side-by-side across five categories to facilitate competitive performance comparison, market advantage analysis, quarterly results review, and product performance benchmarking. The clustered layout enables clear visualization of relative strengths and differences, supporting data-driven decision-making in executive presentations.
-
How to Use
Input data values into the left dark navy chart and right teal-blue chart respectively. Modify the five item labels and corresponding numerical values to reflect actual comparison data. Customize the central text box with key findings or analytical conclusions. Colors can be adjusted to match corporate branding guidelines.
-
Recommended For
Executive performance reports, business results presentations, marketing strategy meetings, competitive analysis documents, quarterly business reviews, product performance comparison decks, investor relations materials, and any professional presentation requiring quantitative side-by-side comparison.
-
Slide Structure
2-slide layout with symmetrical left-right design. Each slide contains two clustered column charts (dark navy and teal-blue) displaying five data items, with a central 'Top quality design' text box and description area. 16:9 widescreen format, fully editable PPTX with all elements customizable.
Related Products
-

Data Analysis with Zombie Hand Graph Visualization
#Market and Competitor Analysis #Graph #Competitor Analysis
-

Comparative Analysis 3D Cylinder Bar Graph – Market and Competitor Analysis
#Market and Competitor Analysis #Graph #Competitor Analysis
-

Competitor Analysis Bar Graph - Visualizing Market Status
#Market and Competitor Analysis #Graph #Competitor Analysis
-

Camera Comparison Competitive Analysis Slide - Data-Driven Strategy
#Market and Competitor Analysis #Graph #Competitor Analysis
