Linear Flow and Schedule – Project Management and Operations Planning
RJ0500032_8
- Last Update 06/16/2025
- File Size 0.6MB
- # of Slides 2
- File Format PPTX
- Slide Ratio 16:9
- Color
Keywords
- #Content-Based Slides
- #Design-Based Slides
- #Business Management
- #Operational Plan
- #Diagram
- #Reporting and Review Plan
- #Project Implementation Schedule
- #Flow
- #Linear Flow
- #16:9
- #linear flow diagram PowerPoint
- #timeline slide template
- #project management diagram
- #business planning PPT slide
- #how to create timeline in PowerPoint
About the Product
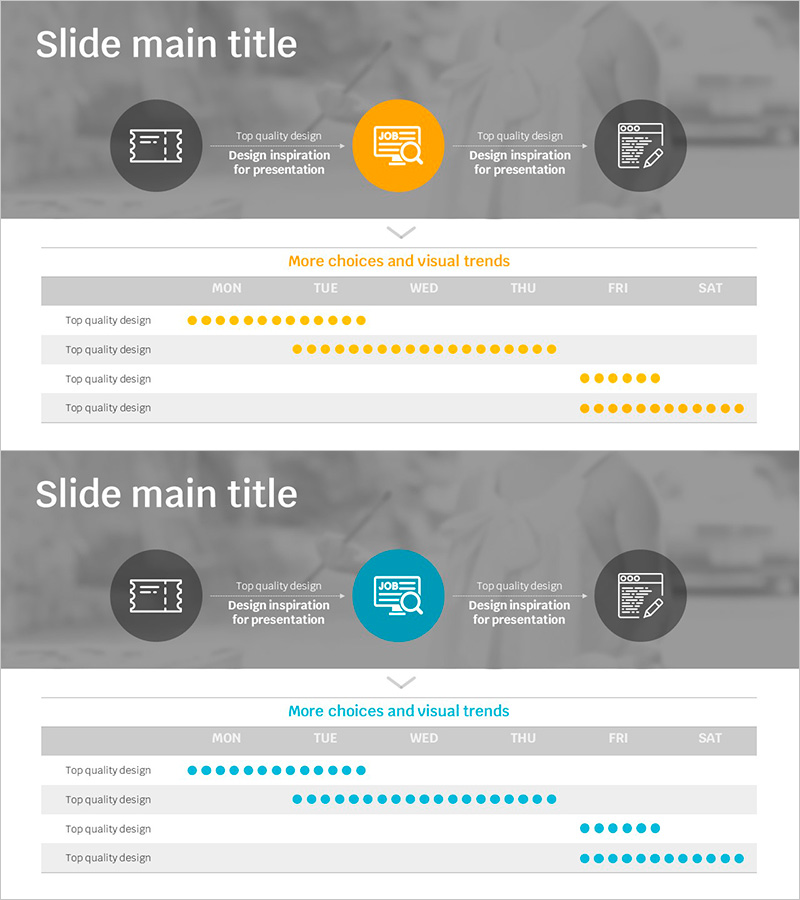
A linear flow diagram PowerPoint slide designed for project management and operations planning presentations. This 2-slide set features both orange and teal color versions, each displaying a 3-stage linear process with a weekly schedule table below. The central circular icon highlights the key stage, while side icons represent related elements. The bottom section includes a day-by-day timeline (MON-SAT) with visual indicators for task duration. Perfect for project status updates, operational planning, and business management presentations.
Usage Points
-
Main Usage
Visualizes project timelines, business process stages, and operational schedules in a linear format. The central icon emphasizes each stage while the timeline table below shows day-by-day progress, making complex schedules easy to understand.
-
How to Use
Insert into project management reports, operations planning presentations, and business kickoff meetings. Customize text and data to reflect actual timelines and stages, then select the color version that matches your corporate branding.
-
Recommended For
Project managers, operations teams, and business planners presenting schedules and progress updates. Ideal for business plans, operational reports, and strategic presentations where process flow clarity is essential.
-
Slide Structure
2-slide set with each slide featuring 3 circular icons at the top (left gray, center orange/teal, right gray) and a weekly schedule table below (MON-SAT). The timeline section contains 4 rows with dot indicators representing task duration across days.
Related Products
-

Timeline Chart Visualizing Yearly Changes – Journey of Success
#Company Introduction #Operational Plan #Diagram
-

Effectiveness Analysis Plan Arrow Diagram
#Business Management #Operational Plan #Diagram
-

Propulsion Plan Linear Diagram – A Visual Tool for Business Operations
#Business Management #Operational Plan #Diagram
-

Security Service Business Promotion Schedule – Technical Sector
#Product/Service Introduction #Operational Plan #Technical Approach
