Orange Paint Line Graph – Market and Competitive Analysis
RJ0500031_28
- Last Update 06/15/2025
- File Size 1.9MB
- # of Slides 2
- File Format PPTX
- Slide Ratio 16:9
- Color
Keywords
- #Content-Based Slides
- #Design-Based Slides
- #Market and Competitor Analysis
- #Graph
- #Competitive Advantage
- #Line
- #Line Chart
- #16:9
- #line graph PowerPoint slide
- #trend analysis presentation template
- #market analysis chart
- #competitive analysis slide
- #business data visualization
- #line chart PowerPoint download
About the Product
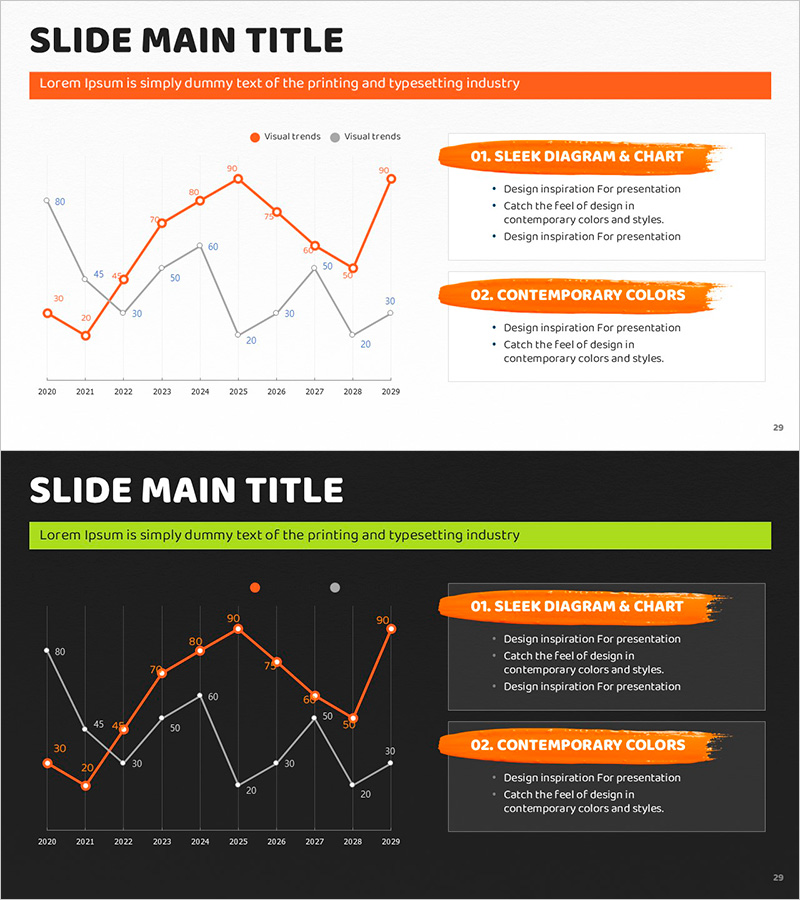
A line graph PowerPoint slide optimized for market analysis and competitive comparison presentations. Featuring two data series in orange and gray, this slide visualizes trends from 2020 to 2029 with clear data point labels for accurate information delivery. The design supports business insights sharing and competitive positioning analysis. Created in 16:9 widescreen format, the slide is fully editable and ready for immediate customization with your own data.
Usage Points
-
Main Usage
Compares two data series over time, such as market trends, competitor performance, or sales progression. The orange accent color highlights primary data while gray represents secondary metrics, enabling clear comparative analysis with precise numerical labels.
-
How to Use
Insert into business plans, quarterly performance reports, investor pitch decks, and marketing strategy presentations within the market analysis section. Simply replace existing data points and axis labels with your own information for immediate presentation use.
-
Recommended For
Executives, marketing managers, business development teams, management consultants, and financial analysts who base decisions on data-driven insights. Particularly valuable for competitive analysis, market research, and performance evaluation presentations.
-
Slide Structure
Two-slide set. Slide 1 features a light background with orange and gray dual-series line graph; Slide 2 displays the same graph structure on a dark background. Each slide includes 8–10 data points spanning 2020–2029, numerical labels, legend, and title area for customization.
Related Products
-

Brown Blue Detailed Analysis Chart - Market and Competitor Analysis
#Market and Competitor Analysis #Diagram #Graph
-

Learning Goal Deflection Line Graph – Business Strategy
#Business Strategy #Market and Competitor Analysis #Graph
-

Social Network Wide Template Line Chart - Market Competition Analysis
#Business Strategy #Market and Competitor Analysis #Graph
-

Line Chart on Creative Thinking Skills – Competitive Advantage Analysis
#Market and Competitor Analysis #Graph #Competitive Advantage
