Fantastic Wide PowerPoint Line Chart – Ideal for Market Analysis
RJ0200049_9
- Last Update 04/12/2025
- File Size 0.8MB
- # of Slides 2
- File Format PPTX
- Slide Ratio 16:9
- Color
Keywords
- #Content-Based Slides
- #Design-Based Slides
- #Market and Competitor Analysis
- #Graph
- #Competitor Analysis
- #Competitive Advantage
- #Line
- #Line Chart
- #16:9
- #line chart PowerPoint
- #multi-series line graph template
- #data trend slide
- #market analysis chart
- #business presentation slides
- #how to create line chart in PowerPoint
About the Product
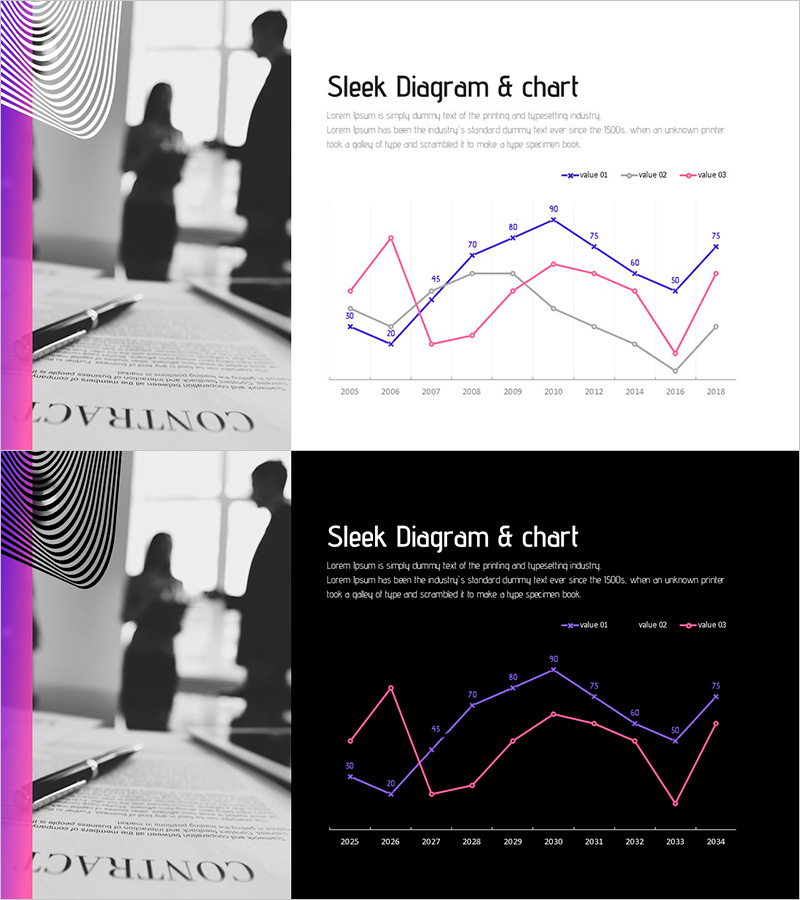
A multi-series line chart PowerPoint slide designed for business data visualization and trend analysis. This presentation template displays three data series (pink, blue, and gray lines) tracking changes from 2005 to 2018, with precise numerical labels at each data point for accurate value comparison. Ideal for market analysis, competitive benchmarking, revenue tracking, and performance metrics in executive presentations. The slide deck includes two design variations—light and dark backgrounds—in 16:9 widescreen format across 2 slides. Each line represents a distinct metric, enabling clear visual comparison of trends over time for strategic decision-making and stakeholder reporting.
Usage Points
-
Main Usage
Visualize and compare multiple data series across time periods to identify trends, patterns, and performance changes. This slide is optimized for presenting revenue growth, customer satisfaction scores, market share evolution, KPI tracking, and competitive positioning analysis.
-
How to Use
Replace the sample data with your own values by editing the chart data table in PowerPoint. Customize line colors, data point labels, and axis ranges to match your presentation theme. Choose between light or dark background versions depending on your venue and display setup.
-
Recommended For
Executives, marketing managers, sales teams, business analysts, and consultants presenting quarterly results, market research findings, competitive analysis, project performance reviews, and strategic forecasts. Particularly effective for investor presentations, board meetings, and internal performance dashboards.
-
Slide Structure
Each slide features an X-axis (years 2005–2018), Y-axis (numerical scale), and three distinct line series with color-coded legends. Data points include numerical labels for precise value reference. Two complete slide designs provided: one with light background and one with dark background for flexible presentation environments.
Related Products
-

Blue Green Broken Line Graph – Competitor Analysis
#Market and Competitor Analysis #Graph #Competitor Analysis
-

Simple Cement Theme Broken Line Graph – Market and Competitor Analysis
#Market and Competitor Analysis #Graph #Competitor Analysis
-

Annual Investment Analysis Graph – Competitor Analysis and Cluster Visualization
#Market and Competitor Analysis #Diagram #Graph
-

Modern Theme Competitor Analysis Graph
#Market and Competitor Analysis #Graph #Competitor Analysis
