Green Yellow Radial Chart
RJ0500031_16
- Last Update 06/15/2025
- File Size 2.1MB
- # of Slides 2
- File Format PPTX
- Slide Ratio 16:9
- Color
Keywords
- #Content-Based Slides
- #Design-Based Slides
- #Market and Competitor Analysis
- #Graph
- #Market Analysis
- #Competitive Advantage
- #Other
- #Radar Chart Spider Chart
- #16:9
- #radial chart PowerPoint
- #5-axis radar chart slide
- #competitive analysis presentation
- #market positioning diagram
- #data visualization PowerPoint template
About the Product
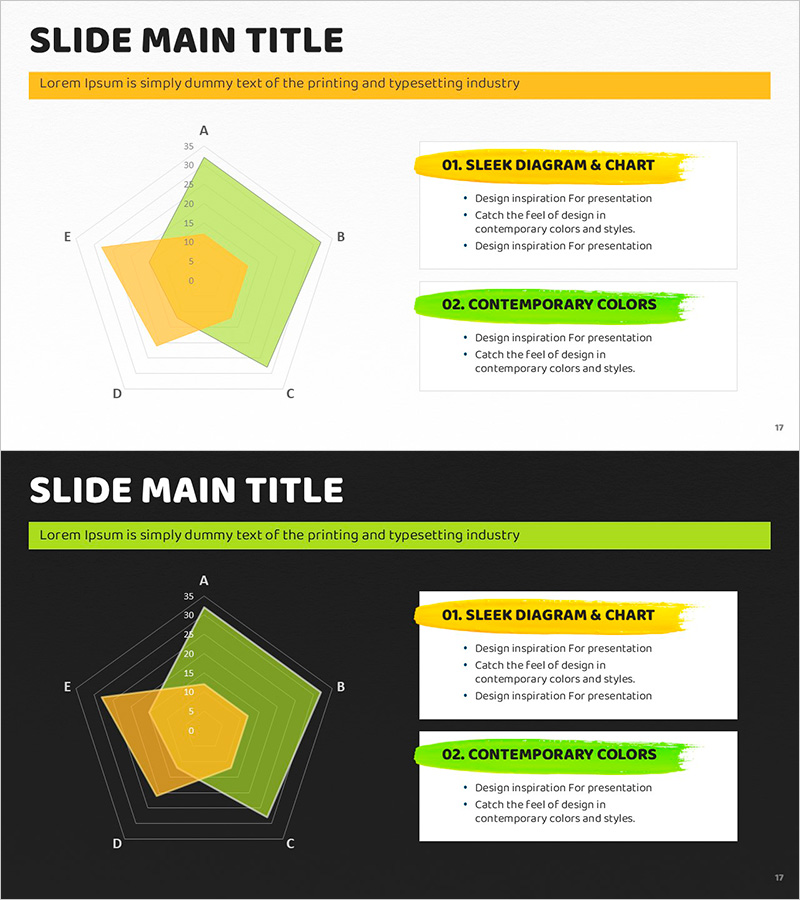
A radial chart PowerPoint slide that compares five competitive dimensions simultaneously using bright green and yellow color zones. This design effectively visualizes market positioning, competitive advantages, and capability assessments across multiple parameters. The 2-slide set includes a standalone chart layout and a combined chart-with-text layout, both in 16:9 widescreen PPTX format ready for immediate editing and customization.
Usage Points
-
Main Usage
Compare five key dimensions simultaneously using a radial diagram that displays strengths and weaknesses at a glance. Perfect for competitive positioning, organizational capability assessment, and product feature comparison in executive presentations.
-
How to Use
Insert this chart into strategy presentations, market analysis sections, or competitive intelligence decks. Simply update the five axis labels and data values with your own metrics; the color-coded zones automatically adjust to reflect your data. Easily modify colors, line weights, and text formatting to match your brand.
-
Recommended For
Business strategists, marketing managers, product teams, sales executives, and management consultants. Ideal for competitive analysis, market positioning, organizational assessment, and product differentiation presentations.
-
Slide Structure
Slide 1: Standalone 5-axis radial chart with overlapping green, yellow, and orange zones. Slide 2: Chart positioned left with two text boxes on the right (yellow and green highlight backgrounds) for key messaging. Total 2 slides in 16:9 format.
Related Products
-

Radial Graph of Data Analysis by Year – Market and Competitive Analysis
#Market and Competitor Analysis #Graph #Market Analysis
-

Curve Graph on a Pegboard – Market and Competitive Analysis
#Market and Competitor Analysis #Graph #Market Analysis
-

Market Analysis and Competitive Advantage Graph – The Power of Data Visualization
#Market and Competitor Analysis #Graph #Market Analysis
-

Real Estate Analysis Charts by Consumer Characteristics – Graphs for Market Insights
#Product/Service Introduction #Market and Competitor Analysis #Graph
