Yellow Mint Table Chart
RJ0500031_14
- Last Update 06/15/2025
- File Size 1.8MB
- # of Slides 2
- File Format PPTX
- Slide Ratio 16:9
- Color
Keywords
- #Content-Based Slides
- #Design-Based Slides
- #Market and Competitor Analysis
- #Financial Plans and Performance
- #Diagram
- #Market Analysis
- #Balance Sheet
- #Table
- #Standard Table
- #16:9
- #table PowerPoint slide
- #data table template
- #3-column table design
- #financial data table
- #market analysis slide
- #table chart PowerPoint
About the Product
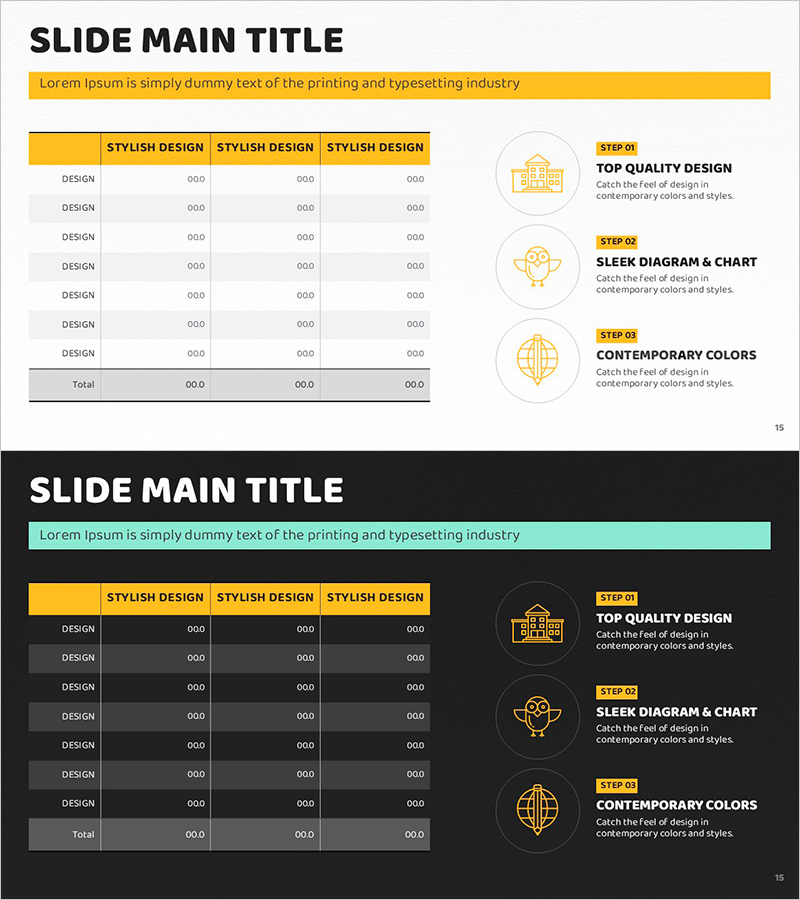
A data table PowerPoint slide featuring a yellow and mint two-tone color scheme. The template includes a 3-column, 7-row table structure ideal for presenting financial data, market analysis, performance comparisons, and numerical information. The header row is highlighted in yellow for clear column distinction, while data cells use white backgrounds with black text for optimal readability. The right side includes a 3-step icon explanation area to visually emphasize key insights. Two slide versions are provided: a light background version and a dark background version, allowing you to choose based on your presentation environment.
Usage Points
-
Main Usage
Organize and compare numerical data such as financial plans, budget status, sales performance, and market analysis. The yellow header row clearly distinguishes column categories, while high-contrast data cells maximize readability of numerical values and ensure professional data presentation.
-
How to Use
Enter your data directly into the table cells. Use the light background version for daytime meetings and presentations, and the dark background version for evening events or large-screen displays. Add key messages to the right-side icon area to enhance data interpretation and audience engagement.
-
Recommended For
Finance teams presenting budget reports and CFO updates, marketing teams sharing market analysis, sales teams reporting performance metrics, executive quarterly reviews, consulting firms preparing client proposals, and academic presentations requiring data comparison sections.
-
Slide Structure
Slide 1 (light background): Yellow header row with 7 data rows plus right-side 3-step icon explanation area. Slide 2 (dark background): Identical table structure with black background, mint header, and white text. Both slides are provided in 16:9 widescreen format for modern presentation displays.
Related Products
-

Yellow Green Income Statement Table – Efficient Financial Analysis
#Financial Plans and Performance #Diagram #Balance Sheet
-

Shareholder Status Survey Donut Graph – Optimized for Market Analysis
#Company Introduction #Market and Competitor Analysis #Diagram
-

Shareholder Status Analysis Slide – Data-Driven Market Insights
#Company Introduction #Market and Competitor Analysis #Diagram
-

Visualizing Competitive Analysis with Table and 3 Donut Graphs
#Market and Competitor Analysis #Diagram #Graph
